Estimated Value: $159,000 - $319,000
4
Beds
2
Baths
1,748
Sq Ft
$133/Sq Ft
Est. Value
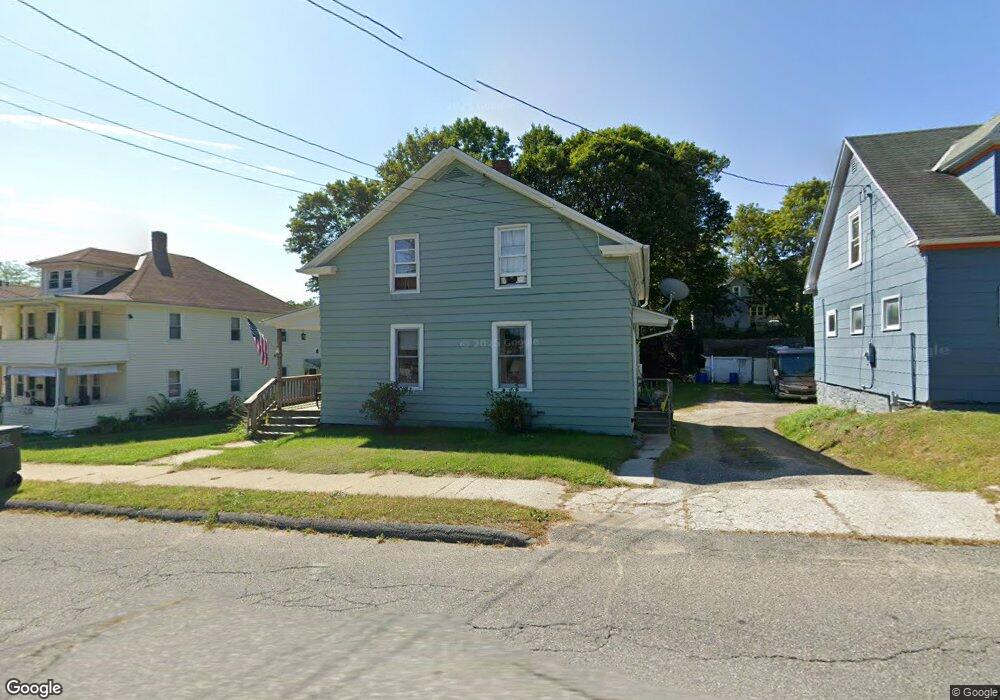
About This Home
This home is located at 32 Maple St, Adams, MA 01220 and is currently estimated at $232,484, approximately $133 per square foot. 32 Maple St is a home located in Berkshire County with nearby schools including Hoosac Valley Middle & High School, Berkshire Arts & Technology Charter Public School, and St. Stanislaus Kostka School.
Ownership History
Date
Name
Owned For
Owner Type
Purchase Details
Closed on
Sep 17, 2024
Sold by
Fillio Barbara A
Bought by
Barbara Ann Fillo Nt and Fillio
Current Estimated Value
Purchase Details
Closed on
Sep 17, 2013
Sold by
Zepka John F and Zepka Maureen A
Bought by
Fillio Barbara A
Home Financials for this Owner
Home Financials are based on the most recent Mortgage that was taken out on this home.
Original Mortgage
$30,000
Interest Rate
4.53%
Purchase Details
Closed on
Mar 19, 2012
Sold by
Zepka Maureen A
Bought by
Zepka John F
Purchase Details
Closed on
Jan 2, 1992
Sold by
Lanier Alfred H and Lanier Delia
Bought by
Ann-Zepka Maureen
Purchase Details
Closed on
Dec 4, 1987
Sold by
Lnier Francis T
Bought by
Lanier Alfred H
Create a Home Valuation Report for This Property
The Home Valuation Report is an in-depth analysis detailing your home's value as well as a comparison with similar homes in the area
Home Values in the Area
Average Home Value in this Area
Purchase History
| Date | Buyer | Sale Price | Title Company |
|---|---|---|---|
| Barbara Ann Fillo Nt | -- | None Available | |
| Barbara Ann Fillo Nt | -- | None Available | |
| Fillio Barbara A | -- | -- | |
| Fillio Barbara A | -- | -- | |
| Zepka John F | -- | -- | |
| Zepka John F | -- | -- | |
| Ann-Zepka Maureen | $80,000 | -- | |
| Ann-Zepka Maureen | $80,000 | -- | |
| Lanier Alfred H | $15,000 | -- |
Source: Public Records
Mortgage History
| Date | Status | Borrower | Loan Amount |
|---|---|---|---|
| Previous Owner | Lanier Alfred H | $30,000 |
Source: Public Records
Tax History
| Year | Tax Paid | Tax Assessment Tax Assessment Total Assessment is a certain percentage of the fair market value that is determined by local assessors to be the total taxable value of land and additions on the property. | Land | Improvement |
|---|---|---|---|---|
| 2025 | $2,529 | $148,700 | $53,600 | $95,100 |
| 2024 | $2,396 | $136,600 | $50,400 | $86,200 |
| 2023 | $2,241 | $120,800 | $45,800 | $75,000 |
| 2022 | $2,181 | $104,400 | $39,800 | $64,600 |
| 2021 | $2,305 | $101,900 | $39,800 | $62,100 |
| 2020 | $2,262 | $103,400 | $39,800 | $63,600 |
| 2019 | $2,212 | $103,400 | $39,800 | $63,600 |
| 2018 | $2,272 | $102,300 | $39,800 | $62,500 |
| 2017 | $2,186 | $102,300 | $39,800 | $62,500 |
| 2016 | $1,912 | $89,400 | $39,800 | $49,600 |
| 2015 | $1,898 | $88,800 | $41,600 | $47,200 |
| 2014 | $1,772 | $88,800 | $41,600 | $47,200 |
Source: Public Records
Map
Nearby Homes