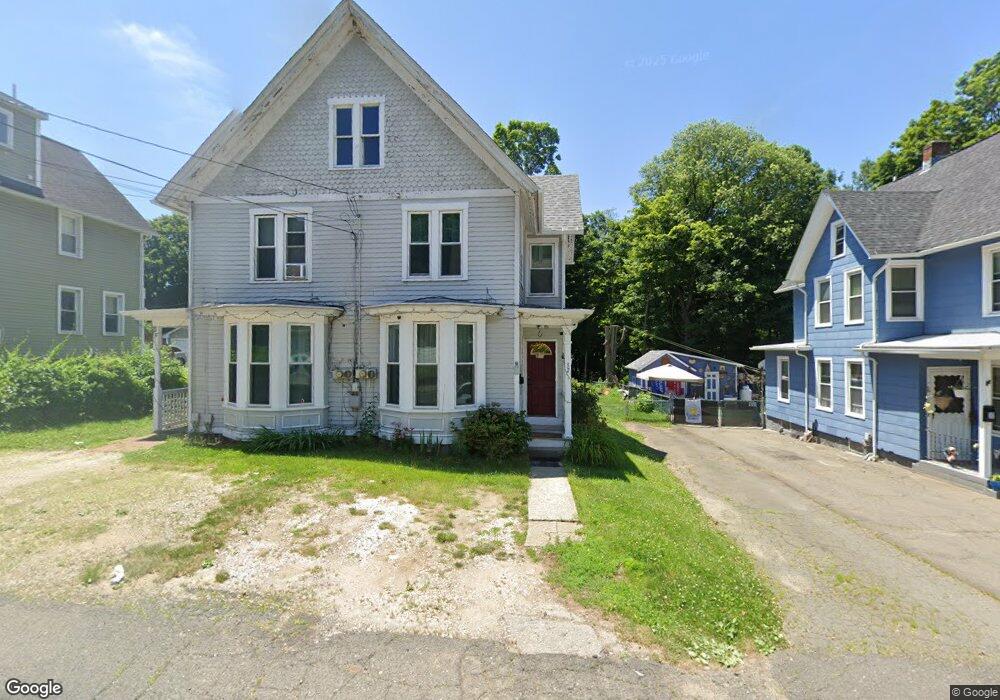
32 Maple St Seymour, CT 06483
Estimated Value: $430,000 - $518,000
6
Beds
2
Baths
2,250
Sq Ft
$220/Sq Ft
Est. Value
About This Home
This home is located at 32 Maple St, Seymour, CT 06483 and is currently estimated at $495,071, approximately $220 per square foot. 32 Maple St is a home located in New Haven County with nearby schools including Seymour Middle School, Seymour High School, and Assumption School.
Ownership History
Date
Name
Owned For
Owner Type
Purchase Details
Closed on
Aug 21, 2025
Sold by
Yacelga Luis and Yacelga Isabel
Bought by
Vintimilla Robert E
Current Estimated Value
Home Financials for this Owner
Home Financials are based on the most recent Mortgage that was taken out on this home.
Original Mortgage
$150,000
Outstanding Balance
$147,345
Interest Rate
6.72%
Mortgage Type
Second Mortgage Made To Cover Down Payment
Estimated Equity
$347,726
Purchase Details
Closed on
Aug 11, 2005
Sold by
Daiuto Michael and Daiuto Michele
Bought by
Yacelga Luis and Yacelga Isabel
Home Financials for this Owner
Home Financials are based on the most recent Mortgage that was taken out on this home.
Original Mortgage
$225,250
Interest Rate
7.87%
Mortgage Type
Purchase Money Mortgage
Purchase Details
Closed on
Dec 21, 1998
Sold by
Quoka Paul
Bought by
Ajm Realty
Purchase Details
Closed on
Dec 30, 1996
Sold by
Baktis Mary
Bought by
Quoka Paul
Create a Home Valuation Report for This Property
The Home Valuation Report is an in-depth analysis detailing your home's value as well as a comparison with similar homes in the area
Home Values in the Area
Average Home Value in this Area
Purchase History
| Date | Buyer | Sale Price | Title Company |
|---|---|---|---|
| Vintimilla Robert E | $514,000 | -- | |
| Yacelga Luis | $301,000 | -- | |
| Yacelga Luis | $301,000 | -- | |
| Ajm Realty | $100,000 | -- | |
| Ajm Realty | $100,000 | -- | |
| Quoka Paul | $45,000 | -- | |
| Quoka Paul | $45,000 | -- |
Source: Public Records
Mortgage History
| Date | Status | Borrower | Loan Amount |
|---|---|---|---|
| Open | Vintimilla Robert E | $150,000 | |
| Previous Owner | Quoka Paul | $225,250 | |
| Previous Owner | Quoka Paul | $75,150 |
Source: Public Records
Tax History Compared to Growth
Tax History
| Year | Tax Paid | Tax Assessment Tax Assessment Total Assessment is a certain percentage of the fair market value that is determined by local assessors to be the total taxable value of land and additions on the property. | Land | Improvement |
|---|---|---|---|---|
| 2025 | $5,726 | $206,570 | $32,340 | $174,230 |
| 2024 | $5,622 | $152,600 | $25,130 | $127,470 |
| 2023 | $5,491 | $152,600 | $25,130 | $127,470 |
| 2022 | $5,431 | $152,600 | $25,130 | $127,470 |
| 2021 | $5,297 | $152,600 | $25,130 | $127,470 |
| 2020 | $4,513 | $125,370 | $29,540 | $95,830 |
| 2019 | $4,513 | $125,370 | $29,540 | $95,830 |
| 2018 | $4,513 | $125,370 | $29,540 | $95,830 |
| 2017 | $4,513 | $125,370 | $29,540 | $95,830 |
| 2016 | $4,513 | $125,370 | $29,540 | $95,830 |
| 2015 | $4,748 | $137,270 | $33,180 | $104,090 |
| 2014 | $4,673 | $137,270 | $33,180 | $104,090 |
Source: Public Records
Map
Nearby Homes
- 77 S Main St
- 26-28 S Main St
- 9 Wooster St
- 72D Walnut St
- 38 Sanford St
- 169 Derby Ave
- 226 Walnut St
- 50 Bissell Place
- 68 New St
- 21 Great Oak Ridge Way Unit 21
- 17 Warren Dr
- 32 Roberts St
- 36 Bungay Terrace
- 61 Pershing Ave
- 80 North St
- 17 Meadow St Unit 23
- 25 Oakwood Dr
- 10 Highland Ave
- 17 Patton Ave
- 9 Omar St