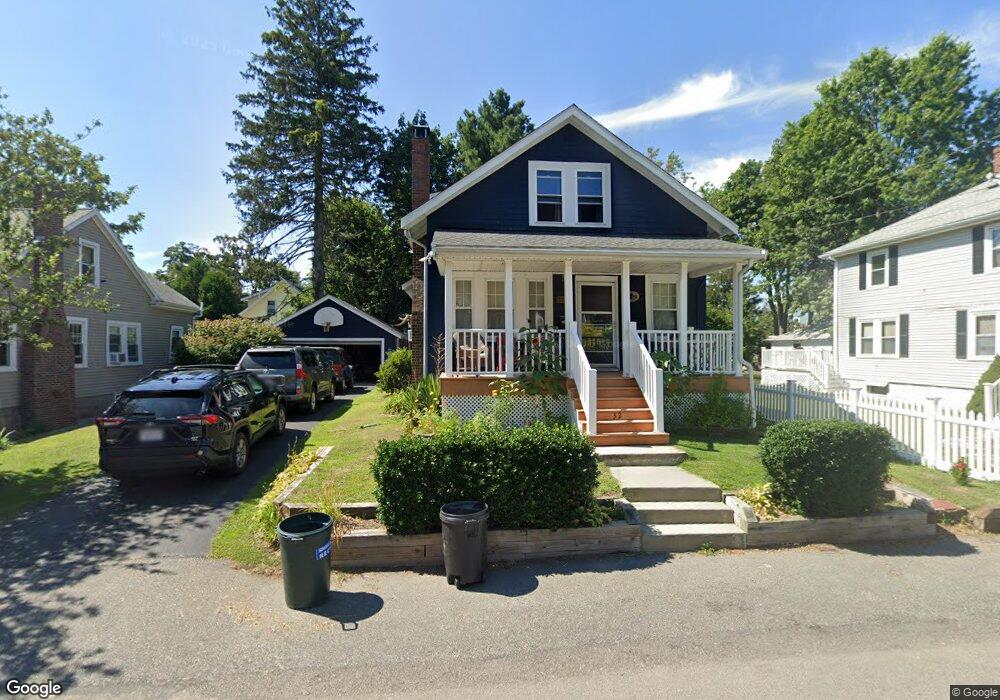
32 McDonald St Quincy, MA 02169
South Quincy NeighborhoodEstimated Value: $575,000 - $612,000
3
Beds
1
Bath
1,113
Sq Ft
$535/Sq Ft
Est. Value
About This Home
This home is located at 32 McDonald St, Quincy, MA 02169 and is currently estimated at $595,836, approximately $535 per square foot. 32 McDonald St is a home located in Norfolk County with nearby schools including South West Middle School, Lincoln-Hancock Community School, and Quincy High School.
Ownership History
Date
Name
Owned For
Owner Type
Purchase Details
Closed on
Jan 29, 1999
Sold by
Mctomney Steven G and Mctomney Lauri J
Bought by
Barrett Virginia M and Barrett Robert W
Current Estimated Value
Home Financials for this Owner
Home Financials are based on the most recent Mortgage that was taken out on this home.
Original Mortgage
$152,000
Outstanding Balance
$35,761
Interest Rate
6.67%
Mortgage Type
Purchase Money Mortgage
Estimated Equity
$560,075
Purchase Details
Closed on
Apr 16, 1992
Sold by
Loughlin Patrick F and Loughlin Margaret H
Bought by
Mctomney Steven G
Create a Home Valuation Report for This Property
The Home Valuation Report is an in-depth analysis detailing your home's value as well as a comparison with similar homes in the area
Home Values in the Area
Average Home Value in this Area
Purchase History
| Date | Buyer | Sale Price | Title Company |
|---|---|---|---|
| Barrett Virginia M | $165,000 | -- | |
| Mctomney Steven G | $130,000 | -- |
Source: Public Records
Mortgage History
| Date | Status | Borrower | Loan Amount |
|---|---|---|---|
| Open | Mctomney Steven G | $20,100 | |
| Open | Mctomney Steven G | $152,000 |
Source: Public Records
Tax History Compared to Growth
Tax History
| Year | Tax Paid | Tax Assessment Tax Assessment Total Assessment is a certain percentage of the fair market value that is determined by local assessors to be the total taxable value of land and additions on the property. | Land | Improvement |
|---|---|---|---|---|
| 2025 | $5,675 | $492,200 | $275,900 | $216,300 |
| 2024 | $5,321 | $472,100 | $262,800 | $209,300 |
| 2023 | $5,011 | $450,200 | $238,900 | $211,300 |
| 2022 | $4,784 | $399,300 | $199,000 | $200,300 |
| 2021 | $4,712 | $388,100 | $199,000 | $189,100 |
| 2020 | $4,561 | $366,900 | $199,000 | $167,900 |
| 2019 | $4,330 | $345,000 | $187,800 | $157,200 |
| 2018 | $4,273 | $320,300 | $173,900 | $146,400 |
| 2017 | $4,191 | $295,800 | $165,600 | $130,200 |
| 2016 | $3,851 | $268,200 | $144,000 | $124,200 |
| 2015 | $3,743 | $256,400 | $144,000 | $112,400 |
| 2014 | $3,595 | $241,900 | $144,000 | $97,900 |
Source: Public Records
Map
Nearby Homes
- 57 Buckley St
- 46-48 Buckley St
- 14 Arthur Ave
- 21 Arthur St
- 211 Copeland St
- 91 Garfield St
- 46 Suomi Rd
- 46 Suomi Rd Unit 46
- 211 West St Unit 12B
- 510 Willard St
- 64 Garfield St Unit B
- 21 Totman St Unit 202
- 21 Totman St Unit 309
- 21 Totman St Unit Model-1
- 21 Totman St Unit 209
- 21 Totman St Unit 203
- 21 Totman St Unit 2
- 94 Brook Rd Unit 3
- 118 Brook Rd Unit 2
- 1 Cityview Ln Unit 506
- 28 McDonald St
- 38 McDonald St
- 16 Station St
- 24 McDonald St
- 20 Station St
- 10 Station St
- 22 Station St
- 29 McDonald St
- 33 McDonald St
- 39 McDonald St
- 39 McDonald St Unit 39
- 39 McDonald St Unit 41
- 39 McDonald St Unit 2
- 25 McDonald St
- 81 Centre St
- 81 Centre St Unit 2
- 77 Centre St
- 10-14 McDonald St
- 28 Station St Unit 2
- 26-28 Station St