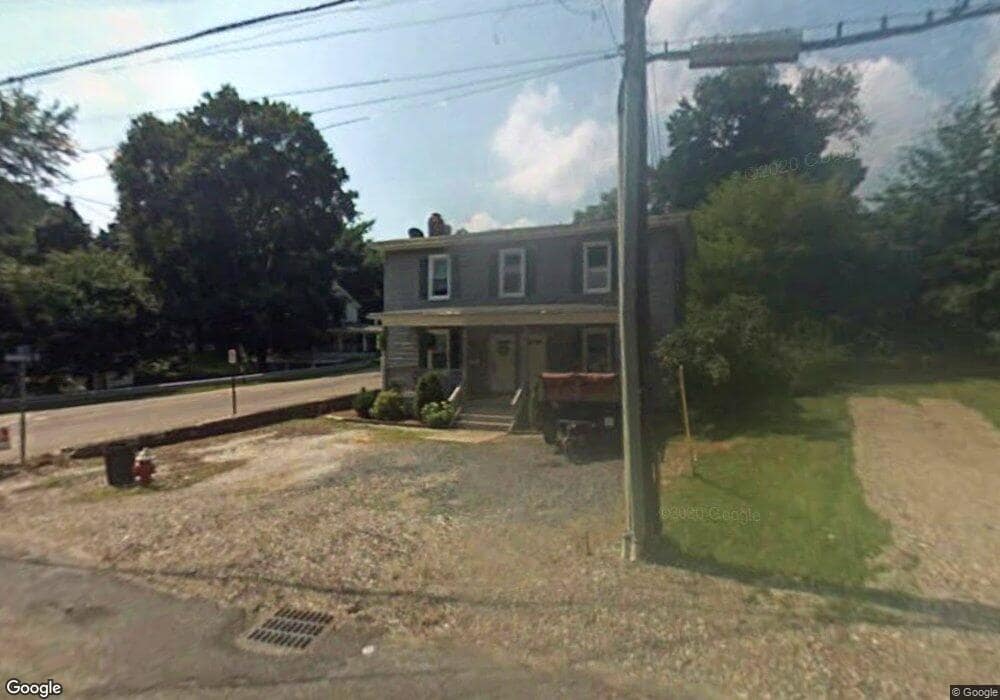
32 Mill St Unit 34 High Bridge, NJ 08829
Estimated Value: $378,000 - $431,498
Studio
--
Bath
1,826
Sq Ft
$225/Sq Ft
Est. Value
About This Home
This home is located at 32 Mill St Unit 34, High Bridge, NJ 08829 and is currently estimated at $410,125, approximately $224 per square foot. 32 Mill St Unit 34 is a home located in Hunterdon County with nearby schools including High Bridge Elementary School, High Bridge Middle School, and Voorhees High School.
Ownership History
Date
Name
Owned For
Owner Type
Purchase Details
Closed on
Feb 23, 2017
Sold by
Borough Oh High Brid
Bought by
Melvin Investments Llc
Current Estimated Value
Purchase Details
Closed on
Apr 21, 2011
Sold by
Nuechterlein Christopher and Nuechterlein Jennifer
Bought by
Melvin Investments Llc
Purchase Details
Closed on
Oct 8, 2008
Sold by
Sloan Cynthia L and Mcpherson Kelly A
Bought by
Nuechterlein Christopher and Nuechterlein Jennifer
Home Financials for this Owner
Home Financials are based on the most recent Mortgage that was taken out on this home.
Original Mortgage
$139,200
Interest Rate
6.43%
Mortgage Type
Purchase Money Mortgage
Create a Home Valuation Report for This Property
The Home Valuation Report is an in-depth analysis detailing your home's value as well as a comparison with similar homes in the area
Home Values in the Area
Average Home Value in this Area
Purchase History
| Date | Buyer | Sale Price | Title Company |
|---|---|---|---|
| Melvin Investments Llc | $2,105 | None Available | |
| Melvin Investments Llc | -- | None Available | |
| Nuechterlein Christopher | $180,000 | None Available |
Source: Public Records
Mortgage History
| Date | Status | Borrower | Loan Amount |
|---|---|---|---|
| Previous Owner | Nuechterlein Christopher | $139,200 |
Source: Public Records
Map
Nearby Homes
Your Personal Tour Guide
Ask me questions while you tour the home.