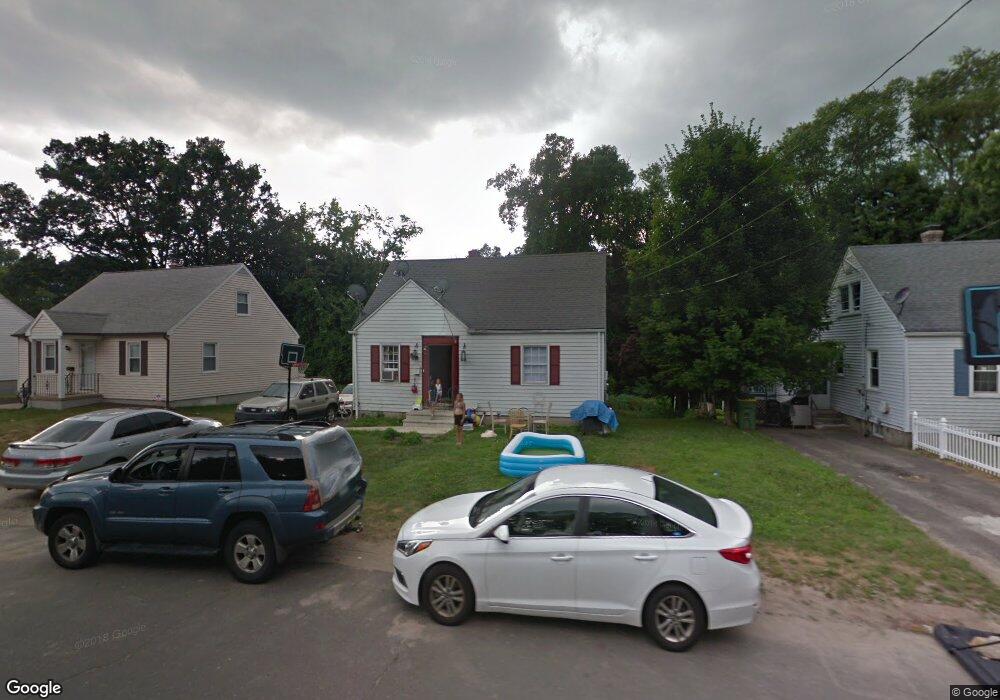
32 Myrna Ave Waterbury, CT 06704
North End District NeighborhoodEstimated Value: $230,000 - $271,000
4
Beds
1
Bath
1,080
Sq Ft
$226/Sq Ft
Est. Value
About This Home
This home is located at 32 Myrna Ave, Waterbury, CT 06704 and is currently estimated at $244,387, approximately $226 per square foot. 32 Myrna Ave is a home located in New Haven County with nearby schools including F. J. Kingsbury School, North End Middle School, and Wilby High School.
Ownership History
Date
Name
Owned For
Owner Type
Purchase Details
Closed on
Jun 16, 2025
Sold by
Festa Michael E
Bought by
32 Myrna Avenue Hldg Llc
Current Estimated Value
Purchase Details
Closed on
Jun 13, 2025
Sold by
32 Myrna Avenue Hldg Llc
Bought by
Festa Michael E
Purchase Details
Closed on
Feb 12, 2015
Sold by
32 Myrna Ave Hldg Llc and Crossway Inv Grp Llc
Bought by
32 Myrna Ave Hldg Llc
Purchase Details
Closed on
Aug 10, 2004
Sold by
Wilson Jeffrey and Wilson Robert J
Bought by
Crossway Inv
Home Financials for this Owner
Home Financials are based on the most recent Mortgage that was taken out on this home.
Original Mortgage
$77,500
Interest Rate
6.2%
Mortgage Type
Purchase Money Mortgage
Create a Home Valuation Report for This Property
The Home Valuation Report is an in-depth analysis detailing your home's value as well as a comparison with similar homes in the area
Home Values in the Area
Average Home Value in this Area
Purchase History
| Date | Buyer | Sale Price | Title Company |
|---|---|---|---|
| 32 Myrna Avenue Hldg Llc | -- | None Available | |
| 32 Myrna Avenue Hldg Llc | -- | None Available | |
| Festa Michael E | -- | None Available | |
| Festa Michael E | -- | None Available | |
| 32 Myrna Ave Hldg Llc | -- | -- | |
| 32 Myrna Ave Hldg Llc | -- | -- | |
| Crossway Inv | $85,000 | -- | |
| Crossway Inv | $85,000 | -- |
Source: Public Records
Mortgage History
| Date | Status | Borrower | Loan Amount |
|---|---|---|---|
| Previous Owner | Crossway Inv | $113,000 | |
| Previous Owner | Crossway Inv | $77,500 |
Source: Public Records
Tax History Compared to Growth
Tax History
| Year | Tax Paid | Tax Assessment Tax Assessment Total Assessment is a certain percentage of the fair market value that is determined by local assessors to be the total taxable value of land and additions on the property. | Land | Improvement |
|---|---|---|---|---|
| 2025 | $3,942 | $87,640 | $19,600 | $68,040 |
| 2024 | $4,333 | $87,640 | $19,600 | $68,040 |
| 2023 | $4,749 | $87,640 | $19,600 | $68,040 |
| 2022 | $3,149 | $52,300 | $19,600 | $32,700 |
| 2021 | $3,149 | $52,300 | $19,600 | $32,700 |
| 2020 | $3,149 | $52,300 | $19,600 | $32,700 |
| 2019 | $3,149 | $52,300 | $19,600 | $32,700 |
| 2018 | $3,149 | $52,300 | $19,600 | $32,700 |
| 2017 | $3,398 | $56,440 | $19,600 | $36,840 |
| 2016 | $3,398 | $56,440 | $19,600 | $36,840 |
| 2015 | $3,286 | $56,440 | $19,600 | $36,840 |
| 2014 | $3,286 | $56,440 | $19,600 | $36,840 |
Source: Public Records
Map
Nearby Homes