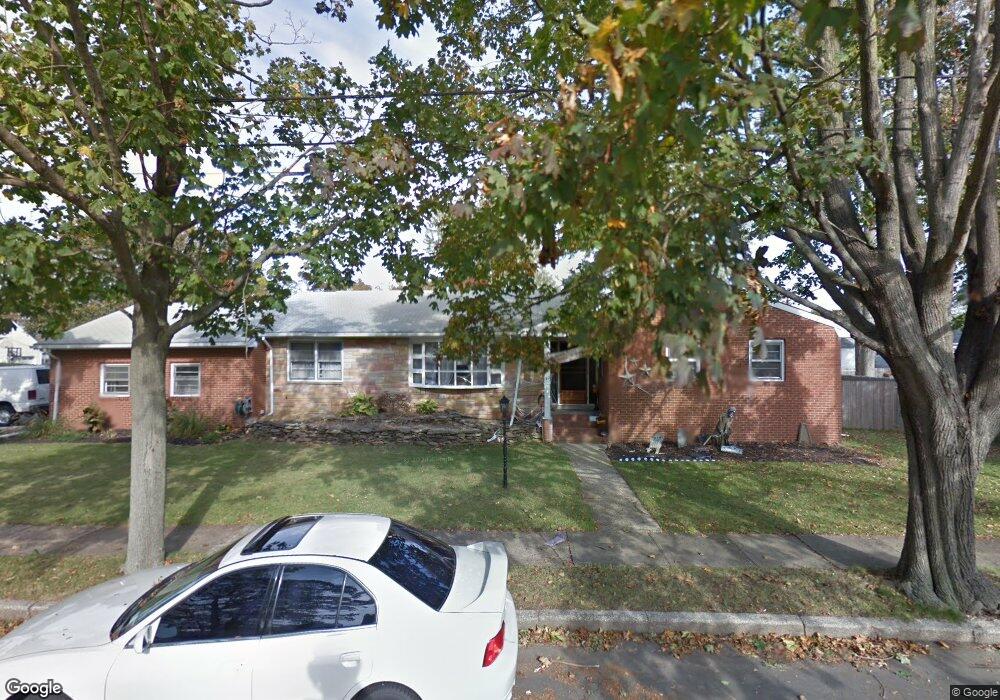
32 N Fulton Ave Lindenhurst, NY 11757
Estimated Value: $658,000 - $754,000
4
Beds
4
Baths
2,036
Sq Ft
$345/Sq Ft
Est. Value
About This Home
This home is located at 32 N Fulton Ave, Lindenhurst, NY 11757 and is currently estimated at $703,166, approximately $345 per square foot. 32 N Fulton Ave is a home located in Suffolk County with nearby schools including Alleghany Avenue School, Lindenhurst Middle School, and Lindenhurst Senior High School.
Ownership History
Date
Name
Owned For
Owner Type
Purchase Details
Closed on
Nov 7, 2013
Sold by
Gaertner John and Gaertner Joann
Bought by
Yankura Peter and Call Dorothea
Current Estimated Value
Home Financials for this Owner
Home Financials are based on the most recent Mortgage that was taken out on this home.
Original Mortgage
$284,000
Outstanding Balance
$211,961
Interest Rate
4.25%
Mortgage Type
New Conventional
Estimated Equity
$491,205
Purchase Details
Closed on
Mar 4, 2003
Sold by
Davide Marie and Caldararo Frank
Bought by
Gaertner John and Millwater Joann
Home Financials for this Owner
Home Financials are based on the most recent Mortgage that was taken out on this home.
Original Mortgage
$150,000
Interest Rate
5.28%
Purchase Details
Closed on
Jul 12, 2002
Sold by
Davide Marie and Caldararo Rose
Bought by
Davide Marie and Caldararo Frank
Create a Home Valuation Report for This Property
The Home Valuation Report is an in-depth analysis detailing your home's value as well as a comparison with similar homes in the area
Home Values in the Area
Average Home Value in this Area
Purchase History
| Date | Buyer | Sale Price | Title Company |
|---|---|---|---|
| Yankura Peter | $355,000 | None Available | |
| Yankura Peter | $355,000 | Security Title | |
| Gaertner John | $340,000 | -- | |
| Davide Marie | -- | Liberty Title Agency |
Source: Public Records
Mortgage History
| Date | Status | Borrower | Loan Amount |
|---|---|---|---|
| Open | Yankura Peter | $284,000 | |
| Closed | Yankura Peter | $284,000 | |
| Previous Owner | Gaertner John | $150,000 |
Source: Public Records
Tax History Compared to Growth
Tax History
| Year | Tax Paid | Tax Assessment Tax Assessment Total Assessment is a certain percentage of the fair market value that is determined by local assessors to be the total taxable value of land and additions on the property. | Land | Improvement |
|---|---|---|---|---|
| 2024 | $14,671 | $3,720 | $440 | $3,280 |
| 2023 | $12,812 | $3,720 | $440 | $3,280 |
| 2022 | $11,234 | $3,720 | $440 | $3,280 |
| 2021 | $11,234 | $3,720 | $440 | $3,280 |
| 2020 | $11,714 | $3,720 | $440 | $3,280 |
| 2019 | $13,342 | $0 | $0 | $0 |
| 2018 | $11,267 | $3,720 | $440 | $3,280 |
| 2017 | $11,267 | $3,720 | $440 | $3,280 |
| 2016 | $11,281 | $3,720 | $440 | $3,280 |
| 2015 | -- | $3,720 | $440 | $3,280 |
| 2014 | -- | $3,720 | $440 | $3,280 |
Source: Public Records
Map
Nearby Homes
- 13 N Fulton Ave
- 261 E Hoffman Ave
- 220 S Clinton Ave
- 247 N Greene Ave
- 144 N Jefferson Ave
- 196 S Broome Ave
- 181 S Alleghany Ave
- 216 S Delaware Ave
- 260 S Broome Ave
- 177 Texas St
- 141 Park Ave
- 106 Grand Ave
- 413 Albert St
- 145 Centre Ave
- 405 N Clinton Ave
- 32 Santapogue Dr
- 52 Dover St
- 22 Bristol St
- 310 Narragansett Villas Dr
- 513 Narragansett Villas Dr Unit 513
- 91 N Greene Ave
- 95 N Greene Ave
- 8 N Fulton Ave
- 87 N Greene Ave
- 33 N Fulton Ave
- 104 N Fulton Ave
- 226 Albert St
- 83 N Greene Ave
- 83 N Greene Ave Unit Main
- 103 N Fulton Ave
- 110 N Fulton Ave
- 109 N Greene Ave
- 109 N Fulton Ave
- 96 N Erie Ave
- 122 N Greene Ave
- 116 N Greene Ave
- 117 N Greene Ave
- 104 N Erie Ave
- 116 N Fulton Ave
- 112 N Greene Ave