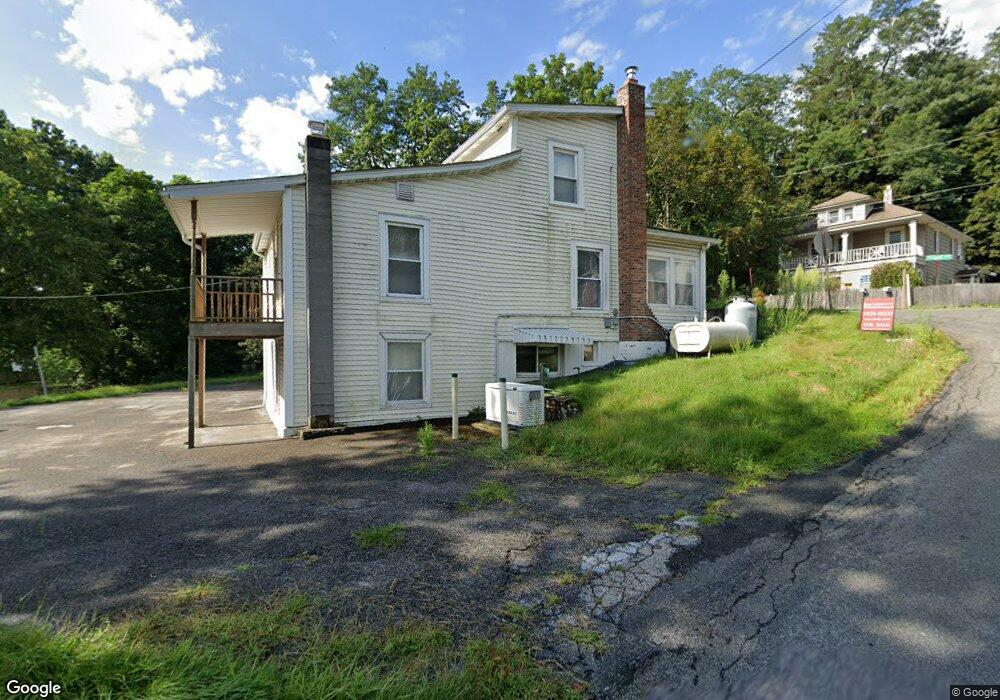
32 N Pierpont Ave Newburgh, NY 12550
Estimated Value: $311,000 - $381,000
3
Beds
2
Baths
1,071
Sq Ft
$321/Sq Ft
Est. Value
About This Home
This home is located at 32 N Pierpont Ave, Newburgh, NY 12550 and is currently estimated at $343,765, approximately $320 per square foot. 32 N Pierpont Ave is a home located in Orange County with nearby schools including Newburgh Free Academy Main Campus, Bishop Dunn Memorial, and San Miguel Academy Of Newburgh.
Ownership History
Date
Name
Owned For
Owner Type
Purchase Details
Closed on
Oct 12, 2023
Sold by
Zeller Robert F Est and Davis
Bought by
Guncay Sumba Luis A and Guncay Bermejo-Quintuna P
Current Estimated Value
Home Financials for this Owner
Home Financials are based on the most recent Mortgage that was taken out on this home.
Original Mortgage
$238,000
Interest Rate
6.62%
Mortgage Type
Purchase Money Mortgage
Purchase Details
Closed on
Dec 19, 1997
Sold by
Ruckdeschel Mary and Bianco Anthony J
Bought by
Ruckdeschel Mary
Purchase Details
Closed on
Nov 5, 1996
Sold by
Williams Patricia H
Bought by
Williams Patricia H and Williams Charlene P
Purchase Details
Closed on
Oct 21, 1996
Sold by
Sinapole Carole A and Sinapole Carola M
Bought by
Williams Patricia H
Create a Home Valuation Report for This Property
The Home Valuation Report is an in-depth analysis detailing your home's value as well as a comparison with similar homes in the area
Home Values in the Area
Average Home Value in this Area
Purchase History
| Date | Buyer | Sale Price | Title Company |
|---|---|---|---|
| Guncay Sumba Luis A | $28,000 | None Available | |
| Guncay Sumba Luis A | $28,000 | None Available | |
| Ruckdeschel Mary | -- | -- | |
| Ruckdeschel Mary | -- | -- | |
| Williams Patricia H | $30,000 | Lawyers Title Insurance Corp | |
| Williams Patricia H | $30,000 | Lawyers Title Insurance Corp | |
| Williams Patricia H | $45,000 | -- | |
| Williams Patricia H | $45,000 | -- |
Source: Public Records
Mortgage History
| Date | Status | Borrower | Loan Amount |
|---|---|---|---|
| Previous Owner | Guncay Sumba Luis A | $238,000 |
Source: Public Records
Tax History Compared to Growth
Tax History
| Year | Tax Paid | Tax Assessment Tax Assessment Total Assessment is a certain percentage of the fair market value that is determined by local assessors to be the total taxable value of land and additions on the property. | Land | Improvement |
|---|---|---|---|---|
| 2024 | $4,964 | $46,500 | $3,800 | $42,700 |
| 2023 | $4,443 | $40,500 | $3,800 | $36,700 |
| 2022 | $4,294 | $40,500 | $3,800 | $36,700 |
| 2021 | $4,575 | $40,500 | $3,800 | $36,700 |
| 2020 | $1,914 | $40,500 | $3,800 | $36,700 |
| 2019 | $1,194 | $40,500 | $3,800 | $36,700 |
| 2018 | $1,194 | $40,500 | $3,800 | $36,700 |
| 2017 | $1,971 | $40,500 | $3,800 | $36,700 |
| 2016 | $1,900 | $40,500 | $3,800 | $36,700 |
| 2015 | -- | $40,500 | $3,800 | $36,700 |
| 2014 | -- | $40,500 | $3,800 | $36,700 |
Source: Public Records
Map
Nearby Homes