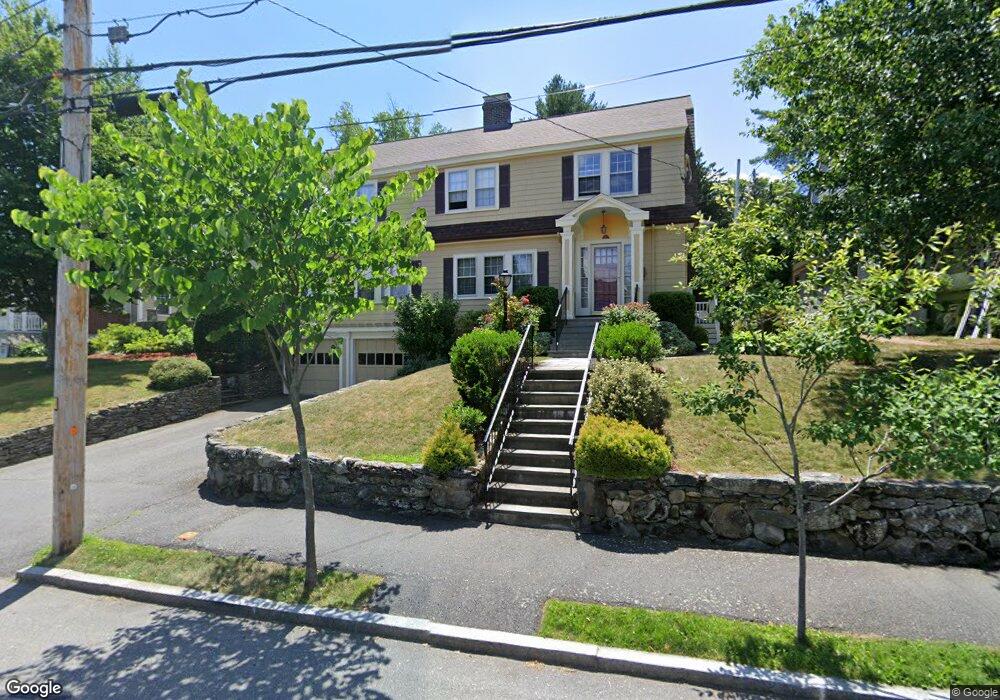
32 Nonantum St Newton, MA 02458
Newton Corner NeighborhoodEstimated Value: $1,742,175 - $1,969,000
4
Beds
3
Baths
2,682
Sq Ft
$687/Sq Ft
Est. Value
About This Home
This home is located at 32 Nonantum St, Newton, MA 02458 and is currently estimated at $1,842,044, approximately $686 per square foot. 32 Nonantum St is a home located in Middlesex County with nearby schools including Underwood Elementary School, Bigelow Middle School, and Newton North High School.
Ownership History
Date
Name
Owned For
Owner Type
Purchase Details
Closed on
Feb 1, 1983
Bought by
Eisenberg Soloman and Terri Barel
Current Estimated Value
Create a Home Valuation Report for This Property
The Home Valuation Report is an in-depth analysis detailing your home's value as well as a comparison with similar homes in the area
Home Values in the Area
Average Home Value in this Area
Purchase History
| Date | Buyer | Sale Price | Title Company |
|---|---|---|---|
| Eisenberg Soloman | $119,000 | -- |
Source: Public Records
Mortgage History
| Date | Status | Borrower | Loan Amount |
|---|---|---|---|
| Closed | Eisenberg Soloman | $50,000 | |
| Closed | Eisenberg Soloman | $86,000 |
Source: Public Records
Tax History Compared to Growth
Tax History
| Year | Tax Paid | Tax Assessment Tax Assessment Total Assessment is a certain percentage of the fair market value that is determined by local assessors to be the total taxable value of land and additions on the property. | Land | Improvement |
|---|---|---|---|---|
| 2025 | $13,663 | $1,394,200 | $956,600 | $437,600 |
| 2024 | $13,211 | $1,353,600 | $928,700 | $424,900 |
| 2023 | $12,607 | $1,238,400 | $703,500 | $534,900 |
| 2022 | $12,063 | $1,146,700 | $651,400 | $495,300 |
| 2021 | $11,640 | $1,081,800 | $614,500 | $467,300 |
| 2020 | $11,294 | $1,081,800 | $614,500 | $467,300 |
| 2019 | $10,976 | $1,050,300 | $596,600 | $453,700 |
| 2018 | $10,531 | $973,300 | $539,000 | $434,300 |
| 2017 | $10,210 | $918,200 | $508,500 | $409,700 |
| 2016 | $9,765 | $858,100 | $475,200 | $382,900 |
| 2015 | $9,311 | $802,000 | $444,100 | $357,900 |
Source: Public Records
Map
Nearby Homes
- 106 Farlow Rd
- 121 Tremont St Unit B1
- 99 Tremont St Unit 105
- 99 Tremont St Unit 413
- 206 Franklin St
- 21 Glenley Terrace
- 70 Washington St Unit 70
- 70 Washington St
- 8 Tremont Place
- 427-435 Faneuil St Unit R4
- 68 Vernon St
- 39 Champney St
- 18 Breck Ave Unit 18
- 69 Presentation Rd
- 180 Hunnewell Ave Unit 180
- 159 Washington St Unit 4
- 65-67 Saint James Cir
- 142 Kenrick St Unit 36
- 59 Hyde Ave
- 32-34 Larch St
- 7 Shornecliffe Rd
- 25 Shornecliffe Rd
- 33 Nonantum St
- 46 Nonantum St
- 31 Shornecliffe Rd
- 39 Nonantum St
- 4 Arlington St
- 45 Nonantum St
- 8 Shornecliffe Rd
- 20 Arlington St
- 39 Shornecliffe Rd
- 52 Nonantum St
- 24 Arlington St
- 24 Arlington St Unit 1
- 24 Arlington St Unit 2
- 14 Shornecliffe Rd
- 18 Shornecliffe Rd
- 22 Shornecliffe Rd
- 15 Nonantum St
- 15 Nonantum Rd Unit 1