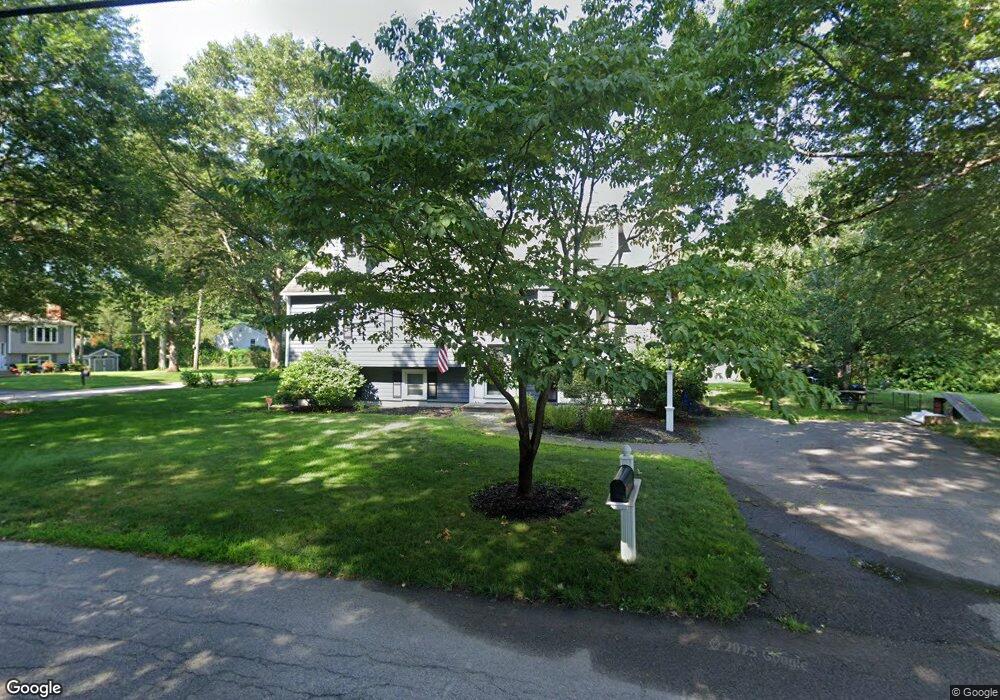
32 Oakdale St Attleboro, MA 02703
Estimated Value: $528,000 - $657,000
5
Beds
3
Baths
2,800
Sq Ft
$203/Sq Ft
Est. Value
About This Home
This home is located at 32 Oakdale St, Attleboro, MA 02703 and is currently estimated at $569,595, approximately $203 per square foot. 32 Oakdale St is a home located in Bristol County with nearby schools including Peter Thacher Elementary School, Wamsutta Middle School, and Attleboro High School.
Ownership History
Date
Name
Owned For
Owner Type
Purchase Details
Closed on
Jul 20, 2020
Sold by
Cross Katherine E and Cross Paul E
Bought by
Cross Paul E
Current Estimated Value
Purchase Details
Closed on
Nov 21, 2011
Sold by
Tedeman Mark and Tedeman Gail A
Bought by
Cross Katherine E
Home Financials for this Owner
Home Financials are based on the most recent Mortgage that was taken out on this home.
Original Mortgage
$278,850
Interest Rate
3.92%
Mortgage Type
Purchase Money Mortgage
Purchase Details
Closed on
Nov 15, 1991
Sold by
Norwood Coop
Bought by
Tedeman Mark and Tedeman Gail
Purchase Details
Closed on
Nov 1, 1991
Sold by
Spaneas Ramona J
Bought by
Norwood Coop Bank
Purchase Details
Closed on
May 26, 1988
Sold by
Pitas Wm B
Bought by
Spaneas Stephen N
Create a Home Valuation Report for This Property
The Home Valuation Report is an in-depth analysis detailing your home's value as well as a comparison with similar homes in the area
Home Values in the Area
Average Home Value in this Area
Purchase History
| Date | Buyer | Sale Price | Title Company |
|---|---|---|---|
| Cross Paul E | -- | None Available | |
| Cross Katherine E | $275,000 | -- | |
| Tedeman Mark | $117,000 | -- | |
| Norwood Coop Bank | $120,000 | -- | |
| Spaneas Stephen N | $158,000 | -- |
Source: Public Records
Mortgage History
| Date | Status | Borrower | Loan Amount |
|---|---|---|---|
| Previous Owner | Spaneas Stephen N | $274,510 | |
| Previous Owner | Cross Katherine E | $278,850 | |
| Previous Owner | Spaneas Stephen N | $35,600 | |
| Previous Owner | Spaneas Stephen N | $116,250 |
Source: Public Records
Tax History Compared to Growth
Tax History
| Year | Tax Paid | Tax Assessment Tax Assessment Total Assessment is a certain percentage of the fair market value that is determined by local assessors to be the total taxable value of land and additions on the property. | Land | Improvement |
|---|---|---|---|---|
| 2025 | $5,836 | $465,000 | $162,800 | $302,200 |
| 2024 | $5,768 | $453,100 | $146,500 | $306,600 |
| 2023 | $6,155 | $449,600 | $148,100 | $301,500 |
| 2022 | $5,127 | $354,800 | $140,900 | $213,900 |
| 2021 | $4,992 | $337,300 | $135,600 | $201,700 |
| 2020 | $4,985 | $342,400 | $129,500 | $212,900 |
| 2019 | $4,486 | $316,800 | $127,000 | $189,800 |
| 2018 | $4,363 | $294,400 | $123,200 | $171,200 |
| 2017 | $4,244 | $291,700 | $120,100 | $171,600 |
| 2016 | $4,135 | $279,000 | $112,300 | $166,700 |
| 2015 | $4,161 | $282,900 | $112,300 | $170,600 |
| 2014 | $3,750 | $252,500 | $107,500 | $145,000 |
Source: Public Records
Map
Nearby Homes
- 31 Oakdale St
- 166 Ingraham St
- 169 Ingraham St
- 44 Oakdale St
- 43 Oakdale St
- 12 Briarwood Dr
- 12 Briarwood Dr Unit 3
- 161 Ingraham St
- 23 Oakdale St
- 18 Briarwood Dr
- 18 Briarwood Dr Unit 1
- 157 Ingraham St
- 102 Dexter St
- 51 Oakdale St
- 69 Oakdale St Unit 14
- 152 Ingraham St Unit 152 Ingraham st attl
- 21 Oakdale St
- 98 Dexter St
- 11 Briarwood Dr
- 48 Oakdale St