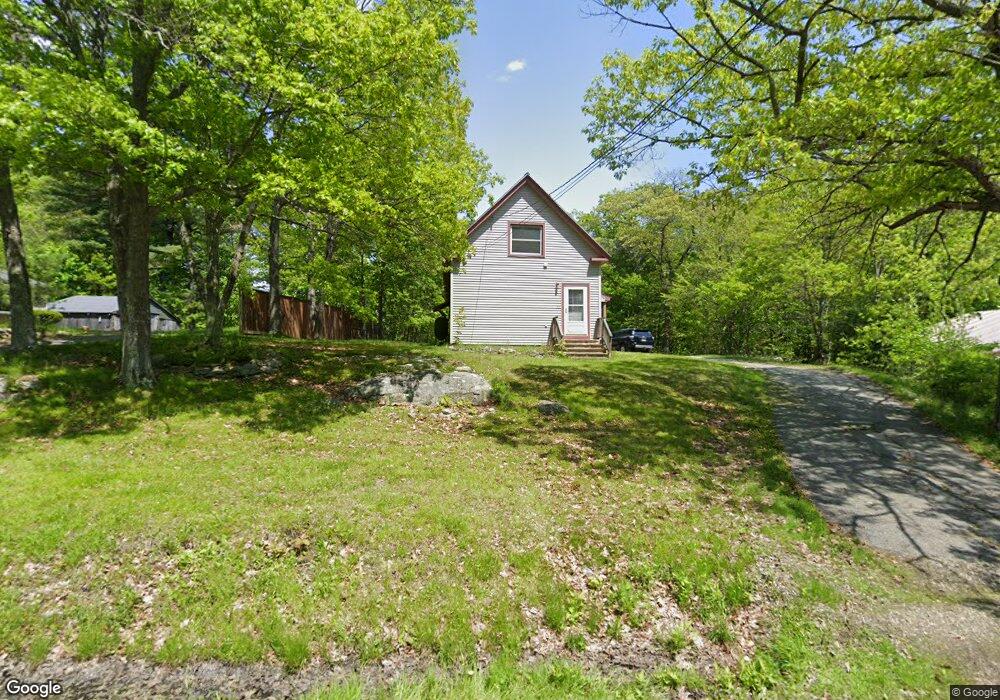
32 Old Arrowsic Rd Woolwich, ME 04579
Estimated Value: $476,000
4
Beds
2
Baths
2,012
Sq Ft
$237/Sq Ft
Est. Value
About This Home
This home is located at 32 Old Arrowsic Rd, Woolwich, ME 04579 and is currently estimated at $476,000, approximately $236 per square foot. 32 Old Arrowsic Rd is a home located in Sagadahoc County with nearby schools including Morse High School and Hyde School.
Ownership History
Date
Name
Owned For
Owner Type
Purchase Details
Closed on
Apr 22, 2014
Sold by
Department Of Housing & Urban Dev
Bought by
Friss Ralph G
Current Estimated Value
Purchase Details
Closed on
Feb 19, 2014
Sold by
Dlj Mortgage Capital Inc
Bought by
Department Of Housing & Urban Dev
Purchase Details
Closed on
Feb 28, 2011
Sold by
Wheeler Scott A and Suntrust Mortgage Inc
Bought by
Wheeler Scott A and Suntrust Mortgage Inc
Purchase Details
Closed on
Apr 10, 2007
Sold by
Petrulli Frank and Petrulli Elena M
Bought by
Wheeler Scott A and Wheeler Danielle G
Home Financials for this Owner
Home Financials are based on the most recent Mortgage that was taken out on this home.
Original Mortgage
$158,598
Interest Rate
6.25%
Mortgage Type
FHA
Create a Home Valuation Report for This Property
The Home Valuation Report is an in-depth analysis detailing your home's value as well as a comparison with similar homes in the area
Home Values in the Area
Average Home Value in this Area
Purchase History
| Date | Buyer | Sale Price | Title Company |
|---|---|---|---|
| Friss Ralph G | -- | -- | |
| Department Of Housing & Urban Dev | -- | -- | |
| Department Of Housing & Urban Dev | -- | -- | |
| Wheeler Scott A | $154,598 | -- | |
| Wheeler Scott A | $154,598 | -- | |
| Wheeler Scott A | -- | -- | |
| Wheeler Scott A | -- | -- |
Source: Public Records
Mortgage History
| Date | Status | Borrower | Loan Amount |
|---|---|---|---|
| Previous Owner | Wheeler Scott A | $158,598 |
Source: Public Records
Tax History
| Year | Tax Paid | Tax Assessment Tax Assessment Total Assessment is a certain percentage of the fair market value that is determined by local assessors to be the total taxable value of land and additions on the property. | Land | Improvement |
|---|---|---|---|---|
| 2025 | $3,062 | $300,200 | $81,400 | $218,800 |
| 2024 | $1,760 | $105,400 | $27,800 | $77,600 |
| 2023 | $1,623 | $105,400 | $27,800 | $77,600 |
| 2022 | $1,623 | $105,400 | $27,800 | $77,600 |
| 2021 | $1,623 | $105,400 | $27,800 | $77,600 |
| 2020 | $1,623 | $105,400 | $27,800 | $77,600 |
| 2019 | $1,597 | $105,400 | $27,800 | $77,600 |
| 2018 | $1,581 | $105,400 | $27,800 | $77,600 |
| 2017 | $3,588 | $105,400 | $27,800 | $77,600 |
| 2016 | $1,497 | $105,400 | $27,800 | $77,600 |
| 2015 | $1,497 | $105,400 | $27,800 | $77,600 |
| 2014 | $1,507 | $105,400 | $27,800 | $77,600 |
| 2013 | $1,936 | $140,300 | $27,800 | $112,500 |
Source: Public Records
Map
Nearby Homes
- 30 Old Arrowsic Rd
- 38 Old Arrowsic Rd
- 26 Old Arrowsic Rd
- Lot 8 Bay Field Subdivision
- Lot 6 Bay Field Subdivision
- 28 Woodbridge Rd
- 37 Old Arrowsic Rd
- Lot 7 Bay Field Subdivision
- Lot 9 Bay Field Subdivision
- Lot 9 Bay Field Dr
- 1 Bay Field Dr
- 4 Reed Rd
- 4 Bay Field Dr
- 22 Old Arrowsic Rd
- 22 Woodbridge Rd
- Lot 10 Bay Field Rd
- 1 Bay Field Rd
- 10 Bay Field Rd
- 21 Bay Field Rd
- 59 Main St
Your Personal Tour Guide
Ask me questions while you tour the home.