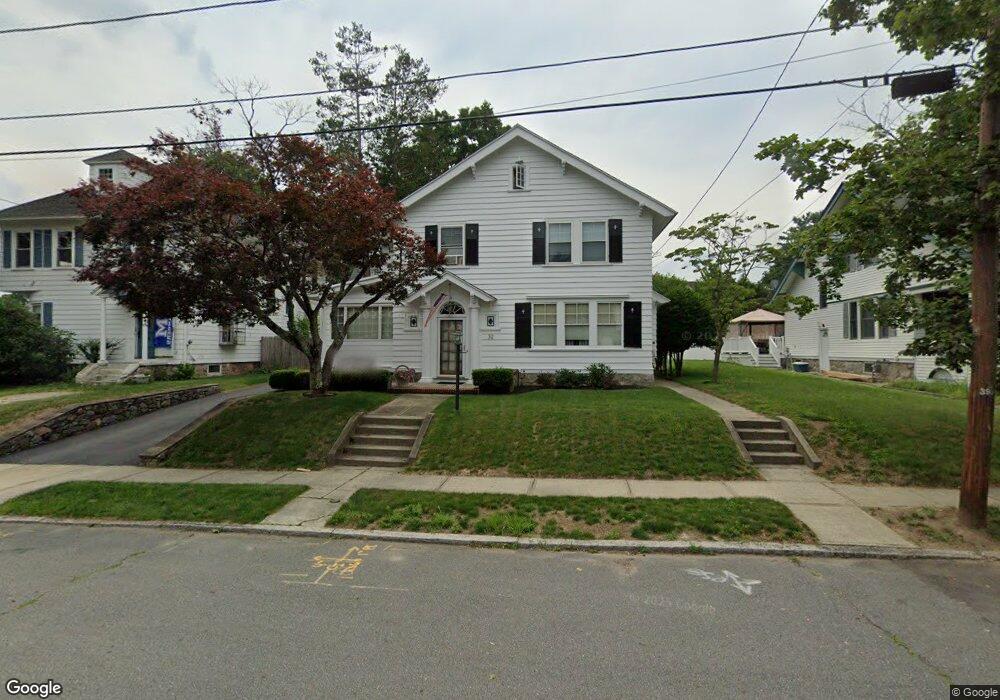
32 Olive St Methuen, MA 01844
The East End NeighborhoodEstimated Value: $565,000 - $647,000
4
Beds
3
Baths
2,848
Sq Ft
$217/Sq Ft
Est. Value
About This Home
This home is located at 32 Olive St, Methuen, MA 01844 and is currently estimated at $618,501, approximately $217 per square foot. 32 Olive St is a home located in Essex County with nearby schools including Timony Grammar School, Methuen High School, and Community Day Charter Public School - Gateway.
Ownership History
Date
Name
Owned For
Owner Type
Purchase Details
Closed on
Feb 7, 2017
Sold by
Potter Donna M and Potter Patric A
Bought by
Potter 2017 T and Potter P
Current Estimated Value
Purchase Details
Closed on
Nov 1, 1984
Bought by
Potter Patric
Create a Home Valuation Report for This Property
The Home Valuation Report is an in-depth analysis detailing your home's value as well as a comparison with similar homes in the area
Home Values in the Area
Average Home Value in this Area
Purchase History
| Date | Buyer | Sale Price | Title Company |
|---|---|---|---|
| Potter 2017 T | -- | -- | |
| Potter 2017 T | -- | -- | |
| Potter 2017 T | -- | -- | |
| Potter Patric | $117,000 | -- |
Source: Public Records
Mortgage History
| Date | Status | Borrower | Loan Amount |
|---|---|---|---|
| Previous Owner | Potter Patric | $40,000 | |
| Previous Owner | Potter Patric | $20,000 | |
| Previous Owner | Potter Patric | $87,000 | |
| Previous Owner | Potter Patric | $15,000 |
Source: Public Records
Tax History
| Year | Tax Paid | Tax Assessment Tax Assessment Total Assessment is a certain percentage of the fair market value that is determined by local assessors to be the total taxable value of land and additions on the property. | Land | Improvement |
|---|---|---|---|---|
| 2025 | $5,639 | $533,000 | $195,400 | $337,600 |
| 2024 | $5,602 | $515,800 | $178,200 | $337,600 |
| 2023 | $5,293 | $452,400 | $158,400 | $294,000 |
| 2022 | $5,009 | $383,800 | $125,400 | $258,400 |
| 2021 | $4,694 | $355,900 | $118,800 | $237,100 |
| 2020 | $4,641 | $345,300 | $118,800 | $226,500 |
| 2019 | $4,389 | $309,300 | $112,200 | $197,100 |
| 2018 | $4,168 | $292,100 | $105,600 | $186,500 |
| 2017 | $3,967 | $270,800 | $105,600 | $165,200 |
| 2016 | $3,815 | $257,600 | $92,400 | $165,200 |
| 2015 | $3,580 | $245,200 | $92,400 | $152,800 |
Source: Public Records
Map
Nearby Homes
- 24 Court St
- 15 Swan Ave
- 24 Boylston St
- 160 1/2 East St
- 35 Swan Ave
- 63 Lippold St
- 6 Longwood Dr
- 5 Weisner Pkwy
- 37 Albion St
- 2 Oak Knoll Rd
- 169 Berkeley St
- 106 Leroy Ave
- 144 Ferry St
- 68 Ashford St
- 21 Oak St Unit A
- 129-131 Lexington St
- 3 Thissell St
- 270 E Haverhill St Unit 12
- 14 Buttonwood Dr
- 192 Union St