32 Olive St Methuen, MA 01844
The East End NeighborhoodEstimated Value: $622,069 - $677,000
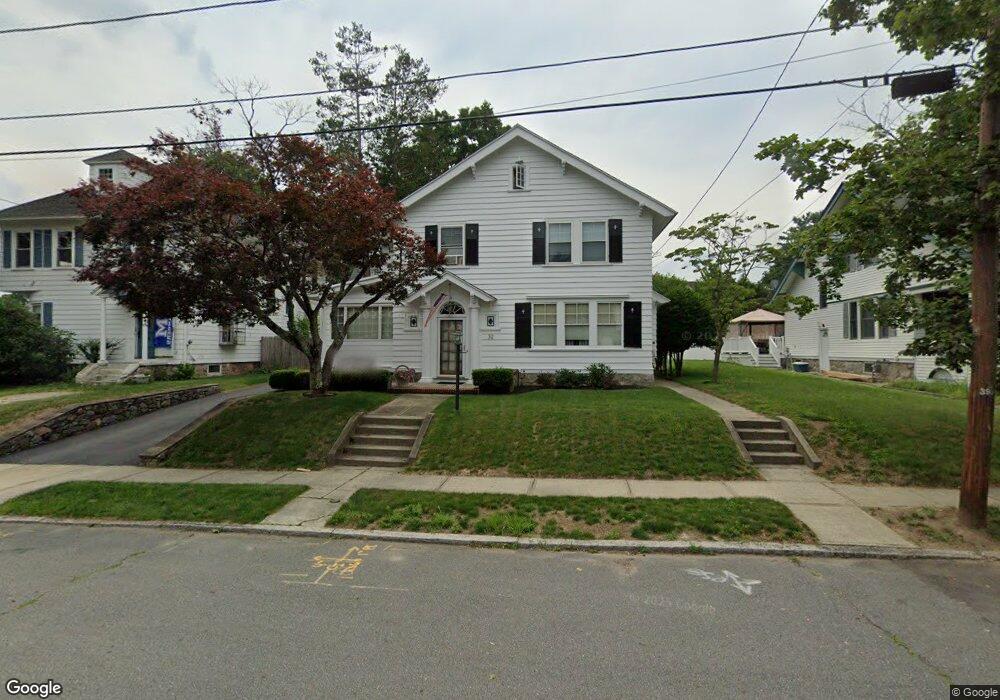
About This Home
This home is located at 32 Olive St, Methuen, MA 01844 and is currently estimated at $640,517, approximately $224 per square foot. 32 Olive St is a home located in Essex County with nearby schools including Timony Grammar School, Methuen High School, and Community Day Charter Public School - Gateway.
Ownership History
We collect this data history from publicly available records. To have your information removed, we recommend requesting removal directly through your county’s website.
Purchase Details
Purchase Details
Home Values in the Area
Average Home Value in this Area
Purchase History
We collect this data history from publicly available records. To have your information removed, we recommend requesting removal directly through your county’s website.
| Date | Buyer | Sale Price | Title Company |
|---|---|---|---|
| -- | -- | ||
| -- | -- | ||
| -- | -- | ||
| $117,000 | -- |
Mortgage History
We collect this data history from publicly available records. To have your information removed, we recommend requesting removal directly through your county’s website.
| Date | Status | Borrower | Loan Amount |
|---|---|---|---|
| Previous Owner | $40,000 | ||
| Previous Owner | $20,000 | ||
| Previous Owner | $87,000 | ||
| Previous Owner | $15,000 |
Tax History
We collect this data history from publicly available records. To have your information removed, we recommend requesting removal directly through your county’s website.
| Year | Tax Paid | Tax Assessment Tax Assessment Total Assessment is a certain percentage of the fair market value that is determined by local assessors to be the total taxable value of land and additions on the property. | Land | Improvement |
|---|---|---|---|---|
| 2025 | $5,639 | $533,000 | $195,400 | $337,600 |
| 2024 | $5,602 | $515,800 | $178,200 | $337,600 |
| 2023 | $5,293 | $452,400 | $158,400 | $294,000 |
| 2022 | $5,009 | $383,800 | $125,400 | $258,400 |
| 2021 | $4,694 | $355,900 | $118,800 | $237,100 |
| 2020 | $4,641 | $345,300 | $118,800 | $226,500 |
| 2019 | $4,389 | $309,300 | $112,200 | $197,100 |
| 2018 | $4,168 | $292,100 | $105,600 | $186,500 |
| 2017 | $3,967 | $270,800 | $105,600 | $165,200 |
| 2016 | $3,815 | $257,600 | $92,400 | $165,200 |
| 2015 | $3,580 | $245,200 | $92,400 | $152,800 |
Map
- 16 Quincy St
- 168 East St
- 171 Ferry St
- 22 Lippold St
- 1 Alderbrook Ln
- 10 Swan St
- 7 Erhardt Terrace
- 2 Bailey St
- 5 Seneca St
- 35 Harmony Ln
- 106 E Haverhill St
- 15-17 Allyn Terrace
- 19 Florence Rd
- 168 Jackson St
- 36 Young Ave Unit B
- 264 E Haverhill St Unit 2
- 264 E Haverhill St Unit 4
- 229 Jackson St
- 262 E Haverhill St Unit 21
- 20 Monmouth St
- 117 Swan St Unit 119
- 117 Swan St Unit 2
- 117 Swan St Unit 1
- 12 Olive St
- 14 Olive St
- 21 Olive St Unit 23
- 21-23 Olive St
- 17-19 Olive St
- 17-19 Olive St Unit 2
- 19 Olive St Unit 2
- 100 Swan St Unit 102
- 121 Swan St Unit 123
- 17 Olive St Unit 19
- 8 Olive St Unit 10
- 13-15 Olive St
- 113 Swan St Unit 115
- 102 Swan St
- 13 Olive St Unit 15
- 96 Swan St Unit 98
- 96-98 Swan St
Ask me questions while you tour the home.