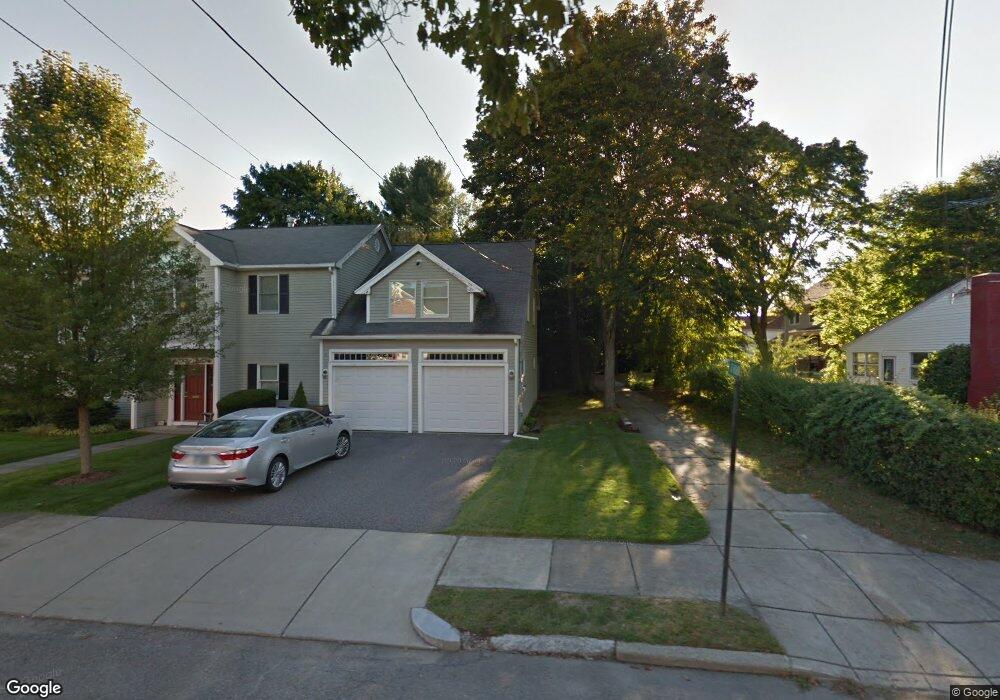
32 Orourke Path Newton Center, MA 02459
Mount Ida NeighborhoodEstimated Value: $1,228,000 - $1,751,000
4
Beds
3
Baths
2,024
Sq Ft
$691/Sq Ft
Est. Value
About This Home
This home is located at 32 Orourke Path, Newton Center, MA 02459 and is currently estimated at $1,398,713, approximately $691 per square foot. 32 Orourke Path is a home located in Middlesex County with nearby schools including Memorial Spaulding Elementary School, Oak Hill Middle School, and Newton South High School.
Ownership History
Date
Name
Owned For
Owner Type
Purchase Details
Closed on
Mar 4, 2009
Sold by
Bergelson Gregory
Bought by
Bergelson Grygory and Bergelson Svetlana
Current Estimated Value
Purchase Details
Closed on
Jul 26, 2004
Sold by
Platt Ian J and Blaskett Laura E
Bought by
Bergelson Gregory
Purchase Details
Closed on
Jul 9, 2001
Sold by
Simozar Saied and Simozar Edna
Bought by
Platt Ian J and Blaskett Laura E
Purchase Details
Closed on
Jul 27, 1998
Sold by
Riklin Jeffrey and Reilly Elizabeth A
Bought by
Simozar Saied and Simozar Edna
Purchase Details
Closed on
May 7, 1997
Sold by
Bystock Marc D
Bought by
Riklin Jeffrey and Reilly Elizabeth A
Purchase Details
Closed on
Dec 1, 1993
Sold by
Levin Howard and Levin Patricia
Bought by
Bystock Marc D
Create a Home Valuation Report for This Property
The Home Valuation Report is an in-depth analysis detailing your home's value as well as a comparison with similar homes in the area
Home Values in the Area
Average Home Value in this Area
Purchase History
| Date | Buyer | Sale Price | Title Company |
|---|---|---|---|
| Bergelson Grygory | -- | -- | |
| Bergelson Gregory | $630,000 | -- | |
| Platt Ian J | $529,000 | -- | |
| Simozar Saied | $383,000 | -- | |
| Riklin Jeffrey | $219,000 | -- | |
| Bystock Marc D | $161,000 | -- |
Source: Public Records
Mortgage History
| Date | Status | Borrower | Loan Amount |
|---|---|---|---|
| Open | Bystock Marc D | $398,000 | |
| Closed | Bystock Marc D | $408,500 |
Source: Public Records
Tax History Compared to Growth
Tax History
| Year | Tax Paid | Tax Assessment Tax Assessment Total Assessment is a certain percentage of the fair market value that is determined by local assessors to be the total taxable value of land and additions on the property. | Land | Improvement |
|---|---|---|---|---|
| 2025 | $9,885 | $1,008,700 | $668,500 | $340,200 |
| 2024 | $9,558 | $979,300 | $649,000 | $330,300 |
| 2023 | $9,014 | $885,500 | $494,300 | $391,200 |
| 2022 | $8,625 | $819,900 | $457,700 | $362,200 |
| 2021 | $8,323 | $773,500 | $431,800 | $341,700 |
| 2020 | $8,075 | $773,500 | $431,800 | $341,700 |
| 2019 | $7,848 | $751,000 | $419,200 | $331,800 |
| 2018 | $7,506 | $693,700 | $379,800 | $313,900 |
| 2017 | $7,277 | $654,400 | $358,300 | $296,100 |
| 2016 | $6,960 | $611,600 | $334,900 | $276,700 |
| 2015 | $6,636 | $571,600 | $313,000 | $258,600 |
Source: Public Records
Map
Nearby Homes
- 22 Nightingale Path
- 30 K Roadway
- 141 Spiers Rd
- 544 Saw Mill Brook Pkwy
- 30 Esty Farm Rd
- 36 Ober Rd
- 210 Nahanton St Unit 404
- 21 Lovett Rd
- 44 Lovett Rd
- 579 Baker St Unit 579
- 207 Nahanton St Unit 207
- 577 Baker St Unit 577
- 1206 Lagrange St Unit 1206
- 931 Lagrange St
- 845 Lagrange St Unit 4
- 135 Hartman Rd
- 17 Tirrell Crescent
- 63 Drumlin Rd
- 41 Juniper Ln
- 58 Country Club Rd
- 32 Orourke Path T Rdwy
- 24 Orourke Path
- 21 Callahan Path
- 24 O'Rourke Path
- 35 Orourke Path Unit 35
- 35 Orourke Path
- 35 Orourke Path
- 35 Orourke Path
- 35 O'Rourke Path
- 25 Orourke Path
- 25 O'Rourke Path
- 18 Orourke Path
- 9 Callahan Path
- 17 Orourke Path
- 41 Callahan Path
- 25 Caldon Path
- 35 Caldon Path
- 10 Orourke Path
- Lot 12 Block 69
- 17 Caldon Path