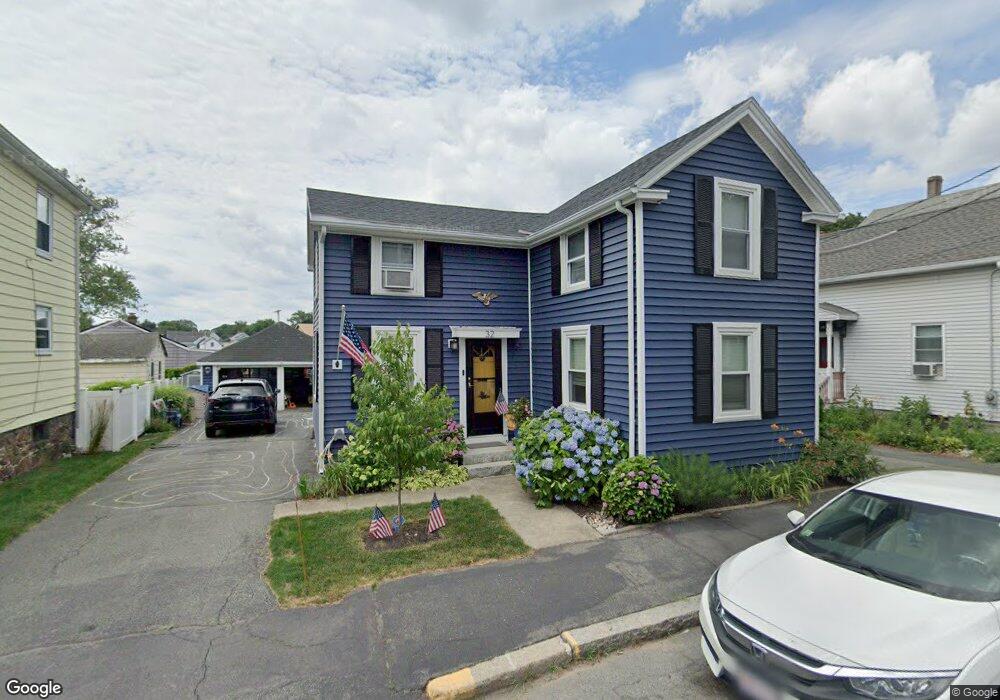
32 Osgood St Salem, MA 01970
Bridge Street NeighborhoodEstimated Value: $566,000 - $606,000
2
Beds
2
Baths
1,249
Sq Ft
$465/Sq Ft
Est. Value
About This Home
This home is located at 32 Osgood St, Salem, MA 01970 and is currently estimated at $580,524, approximately $464 per square foot. 32 Osgood St is a home located in Essex County with nearby schools including Carlton Elementary School, Saltonstall School, and Bates Elementary School.
Ownership History
Date
Name
Owned For
Owner Type
Purchase Details
Closed on
Jan 2, 2004
Sold by
Hart Elizabeth A
Bought by
Brophy Thomas M
Current Estimated Value
Home Financials for this Owner
Home Financials are based on the most recent Mortgage that was taken out on this home.
Original Mortgage
$175,200
Interest Rate
5.86%
Mortgage Type
Purchase Money Mortgage
Create a Home Valuation Report for This Property
The Home Valuation Report is an in-depth analysis detailing your home's value as well as a comparison with similar homes in the area
Home Values in the Area
Average Home Value in this Area
Purchase History
| Date | Buyer | Sale Price | Title Company |
|---|---|---|---|
| Brophy Thomas M | $219,000 | -- |
Source: Public Records
Mortgage History
| Date | Status | Borrower | Loan Amount |
|---|---|---|---|
| Open | Brophy Thomas M | $264,000 | |
| Closed | Brophy Thomas M | $241,200 | |
| Closed | Brophy Thomas M | $175,200 |
Source: Public Records
Tax History Compared to Growth
Tax History
| Year | Tax Paid | Tax Assessment Tax Assessment Total Assessment is a certain percentage of the fair market value that is determined by local assessors to be the total taxable value of land and additions on the property. | Land | Improvement |
|---|---|---|---|---|
| 2025 | $5,233 | $461,500 | $166,000 | $295,500 |
| 2024 | $5,064 | $435,800 | $157,200 | $278,600 |
| 2023 | $4,878 | $389,900 | $145,600 | $244,300 |
| 2022 | $4,725 | $356,600 | $136,800 | $219,800 |
| 2021 | $4,790 | $347,100 | $136,800 | $210,300 |
| 2020 | $4,435 | $306,900 | $118,200 | $188,700 |
| 2019 | $4,272 | $282,900 | $112,400 | $170,500 |
| 2018 | $4,143 | $269,400 | $107,100 | $162,300 |
| 2017 | $3,810 | $240,200 | $87,300 | $152,900 |
| 2016 | $3,692 | $235,600 | $82,700 | $152,900 |
| 2015 | $3,579 | $218,100 | $74,500 | $143,600 |
Source: Public Records
Map
Nearby Homes
- 14 Lathrop St
- 12 Thorndike St
- 103 Bridge St Unit 2
- 10 Andrew St Unit 2A
- 21 Emerton St Unit 2
- 156 Bridge St Unit B
- 26 Winter St
- 16 Williams St
- 40 Essex St Unit 2
- 8 Williams St Unit 2
- 5 Larchmont Rd Unit 3
- 41 Dearborn St
- 67 Essex St Unit 2
- 67 Essex St Unit 1
- 69 Essex St Unit 2
- 18 Franklin St Unit 303
- 7 Curtis St Unit 1
- 117 Water St Unit 28
- 131 Derby St Unit 3F
- 131 Derby St Unit 3R
- 28 Osgood St
- 36 Osgood St
- 26 Osgood St
- 26 Osgood St Unit 2
- 33 Osgood St Unit 1
- 33 Osgood St
- 33 Osgood St Unit 2
- 35 Osgood St
- 18 E Collins St
- 22 Osgood St
- 15 E Collins St
- 18 Osgood St
- 39 Osgood St
- 25 Osgood St
- 12 E Collins St
- 31 Osgood St
- 41 Osgood St Unit 43
- 43 Osgood St Unit 43
- 41 Osgood St Unit 41
- 43 Osgood St