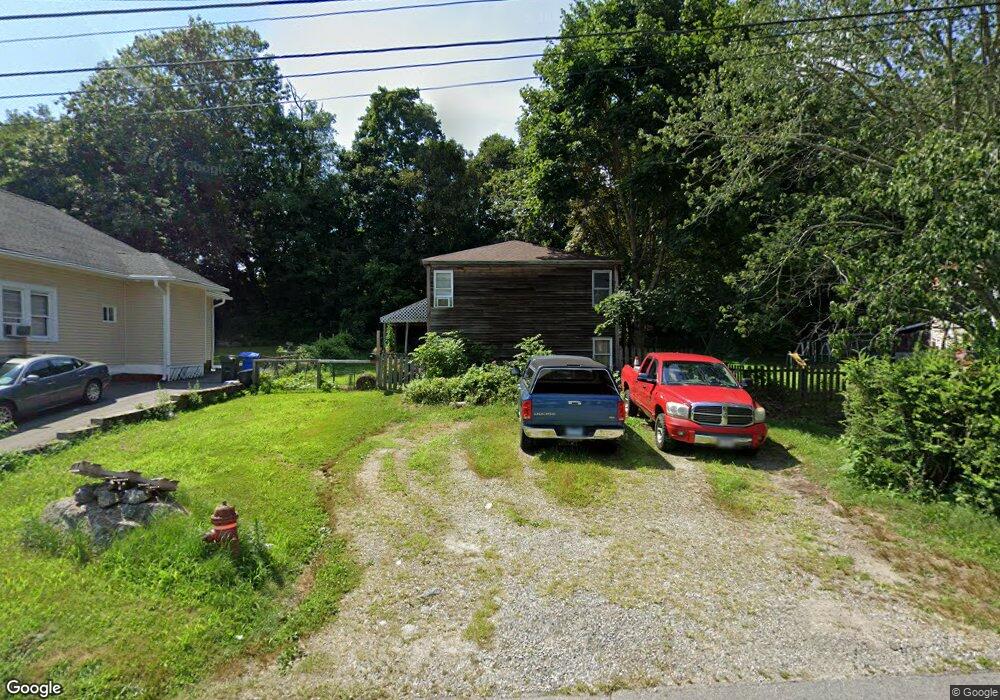
32 Page St Norwich, CT 06360
Central Norwich NeighborhoodEstimated Value: $242,000 - $252,000
3
Beds
2
Baths
960
Sq Ft
$257/Sq Ft
Est. Value
About This Home
This home is located at 32 Page St, Norwich, CT 06360 and is currently estimated at $246,783, approximately $257 per square foot. 32 Page St is a home located in New London County with nearby schools including John B. Stanton Elementary School, Teachers' Memorial Global Studies Magnet Middle, and Integrated Day Charter School.
Ownership History
Date
Name
Owned For
Owner Type
Purchase Details
Closed on
Jun 22, 1993
Sold by
Eastern Sl & A
Bought by
Harris John R and Harris Heather
Current Estimated Value
Home Financials for this Owner
Home Financials are based on the most recent Mortgage that was taken out on this home.
Original Mortgage
$79,000
Interest Rate
4.75%
Mortgage Type
Unknown
Create a Home Valuation Report for This Property
The Home Valuation Report is an in-depth analysis detailing your home's value as well as a comparison with similar homes in the area
Home Values in the Area
Average Home Value in this Area
Purchase History
| Date | Buyer | Sale Price | Title Company |
|---|---|---|---|
| Harris John R | $85,000 | -- | |
| Harris John R | $85,000 | -- |
Source: Public Records
Mortgage History
| Date | Status | Borrower | Loan Amount |
|---|---|---|---|
| Open | Harris John R | $60,000 | |
| Closed | Harris John R | $79,000 |
Source: Public Records
Tax History
| Year | Tax Paid | Tax Assessment Tax Assessment Total Assessment is a certain percentage of the fair market value that is determined by local assessors to be the total taxable value of land and additions on the property. | Land | Improvement |
|---|---|---|---|---|
| 2025 | $5,581 | $137,900 | $33,000 | $104,900 |
| 2024 | $5,268 | $137,900 | $33,000 | $104,900 |
| 2023 | $4,227 | $86,900 | $19,000 | $67,900 |
| 2022 | $4,213 | $86,900 | $19,000 | $67,900 |
| 2021 | $4,227 | $86,900 | $19,000 | $67,900 |
| 2020 | $4,212 | $86,900 | $19,000 | $67,900 |
| 2019 | $4,170 | $86,900 | $19,000 | $67,900 |
| 2018 | $4,031 | $83,300 | $10,900 | $72,400 |
| 2017 | $4,060 | $83,300 | $10,900 | $72,400 |
| 2016 | $4,087 | $83,300 | $10,900 | $72,400 |
| 2015 | $4,003 | $83,300 | $10,900 | $72,400 |
| 2014 | $3,826 | $83,300 | $10,900 | $72,400 |
Source: Public Records
Map
Nearby Homes
- 113 4th St
- 367 Boswell Ave
- 100 7th St
- 0 7th St
- 188 Central Ave
- 197 Central Ave
- 47 8th St
- 294 Central Ave
- 303 Central Ave
- 687 N Main St
- 24 Central Ave
- 296 Hamilton Ave Unit 30
- 296 Hamilton Ave Unit 25
- 406 Central Ave Unit 408
- 41 Baltic St
- 556 Boswell Ave
- 625 N Main St Unit 627
- 28 Baltic St
- 0 Vine St
- 40 Beech St
Your Personal Tour Guide
Ask me questions while you tour the home.