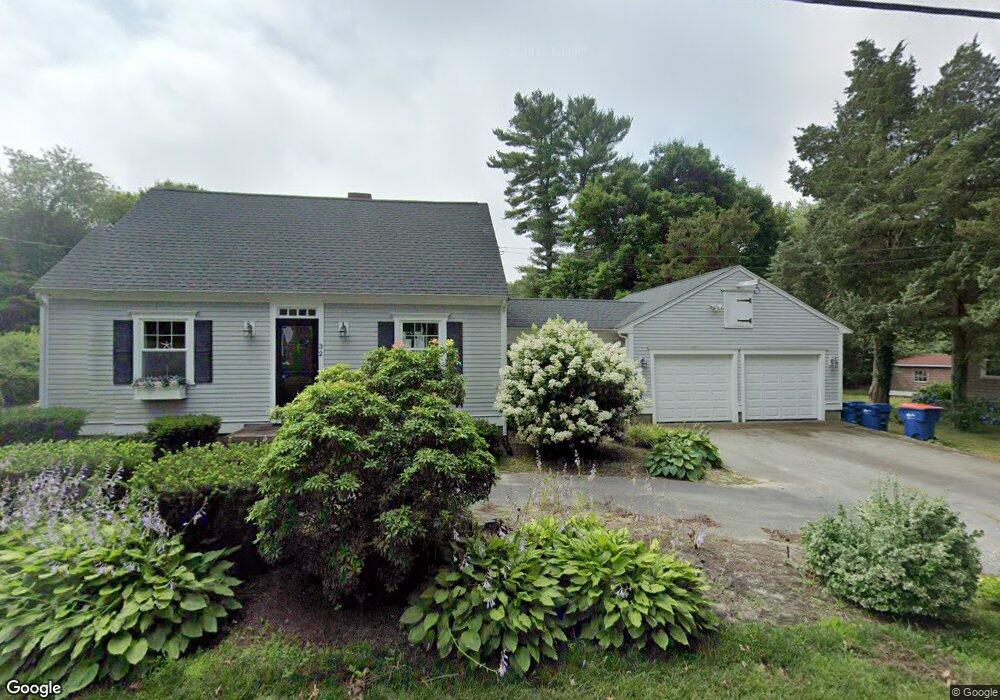
32 Park St Mattapoisett, MA 02739
Estimated Value: $564,000 - $638,000
2
Beds
2
Baths
1,716
Sq Ft
$350/Sq Ft
Est. Value
About This Home
This home is located at 32 Park St, Mattapoisett, MA 02739 and is currently estimated at $600,894, approximately $350 per square foot. 32 Park St is a home located in Plymouth County with nearby schools including Center School, Old Hammondtown Elementary, and Old Rochester Regional High School.
Ownership History
Date
Name
Owned For
Owner Type
Purchase Details
Closed on
Jun 21, 2021
Sold by
Jjc Ret and Lopes
Bought by
Lopes Tiffany and Lopes Carolyn A
Current Estimated Value
Home Financials for this Owner
Home Financials are based on the most recent Mortgage that was taken out on this home.
Original Mortgage
$180,000
Outstanding Balance
$162,612
Interest Rate
2.9%
Mortgage Type
Purchase Money Mortgage
Estimated Equity
$438,282
Purchase Details
Closed on
Oct 11, 2007
Sold by
Lopes Carolyn and Decosta John N
Bought by
Jjc Rt and Lopes Carolyn
Create a Home Valuation Report for This Property
The Home Valuation Report is an in-depth analysis detailing your home's value as well as a comparison with similar homes in the area
Home Values in the Area
Average Home Value in this Area
Purchase History
| Date | Buyer | Sale Price | Title Company |
|---|---|---|---|
| Lopes Tiffany | $168,000 | None Available | |
| Lopes Tiffany | $168,000 | None Available | |
| Jjc Rt | $500 | -- | |
| Jjc Rt | $500 | -- |
Source: Public Records
Mortgage History
| Date | Status | Borrower | Loan Amount |
|---|---|---|---|
| Open | Lopes Tiffany | $180,000 | |
| Closed | Lopes Tiffany | $180,000 | |
| Previous Owner | Jjc Rt | $50,000 | |
| Previous Owner | Jjc Rt | $25,000 | |
| Previous Owner | Jjc Rt | $25,000 |
Source: Public Records
Tax History Compared to Growth
Tax History
| Year | Tax Paid | Tax Assessment Tax Assessment Total Assessment is a certain percentage of the fair market value that is determined by local assessors to be the total taxable value of land and additions on the property. | Land | Improvement |
|---|---|---|---|---|
| 2025 | $5,030 | $467,500 | $171,900 | $295,600 |
| 2024 | $4,577 | $435,500 | $171,900 | $263,600 |
| 2023 | $4,656 | $413,900 | $153,500 | $260,400 |
| 2022 | $4,421 | $356,500 | $127,900 | $228,600 |
| 2021 | $4,229 | $326,300 | $142,200 | $184,100 |
| 2020 | $3,989 | $295,700 | $135,400 | $160,300 |
| 2019 | $3,906 | $295,700 | $135,400 | $160,300 |
| 2018 | $3,685 | $283,000 | $119,800 | $163,200 |
| 2017 | $3,597 | $275,200 | $119,800 | $155,400 |
| 2016 | $3,505 | $265,500 | $125,800 | $139,700 |
| 2015 | $3,374 | $259,500 | $119,800 | $139,700 |
| 2014 | $3,199 | $251,500 | $119,800 | $131,700 |
Source: Public Records
Map
Nearby Homes
- 13 Park Place
- 9 Hitching Post Rd
- 35 North St
- 47 Fairhaven Rd
- 7 Pearl St
- 12 Cannon St
- 8 Captains Ln
- 11 Captains Ln
- 52 Prince Snow Cir
- 19 High Ridge Dr
- 83 Fairhaven Rd
- 15 Ned's Point Rd
- 31 Split Rock Ln
- 0 Whalers Way
- 1 Starboard Way
- 3 Brandt Island Rd
- 41 Starboard Way
- 2 Golf Cottage Way
- 4 Golf Cottage Way
- 3 Rock St