
Landlord's Agent in 2025
Lindsay Higgins
The Market
(857) 201-2461
17 Total Sales
Estimated Value: $513,000 - $579,000
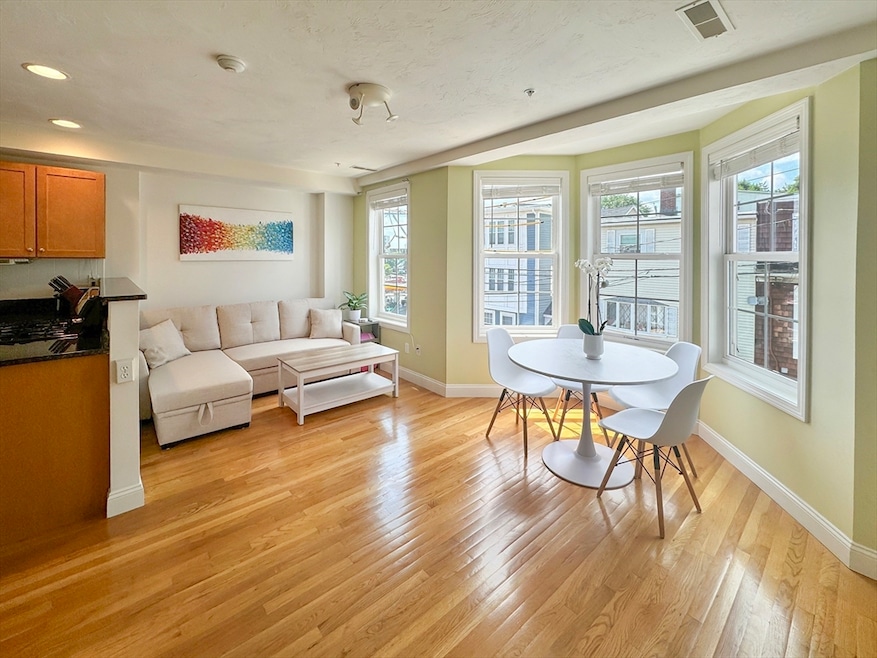
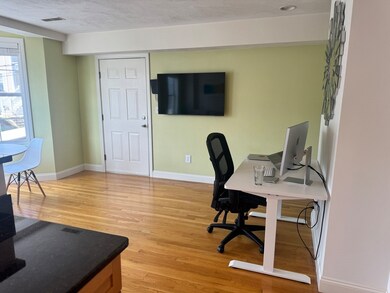
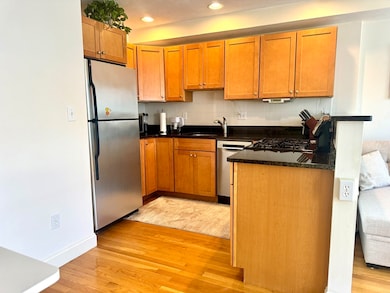
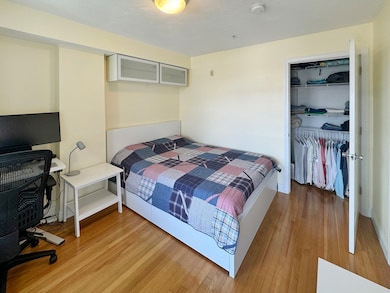
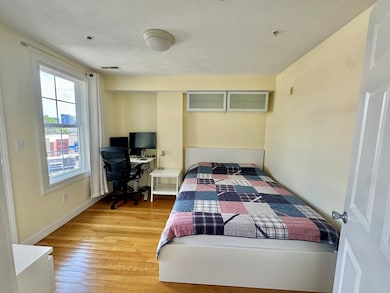
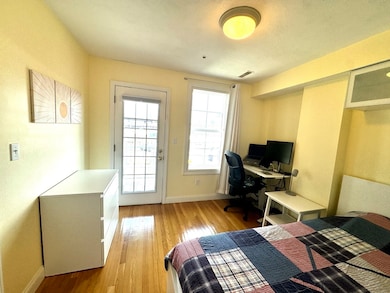
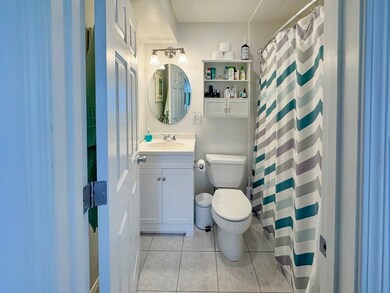
A great AIRBNB ALTERNATIVE ideal for corporate travelers! Fully FURNISHED 1-bedroom, 1-bath apartment available through May 31, 2026. Please note this rental has a firm lease end time frame so there is no option to renew annually. Rent includes all utilities and WiFi. Features a pull-out sofa, wall-mounted TV, dining table with 4 chairs, and a dedicated desk/workspace. Private washer/dryer located just outside the front door. Bedroom includes a queen bed, overhead storage, large closet, and access to a private patio. Smart lock entry for easy move-in. Located 0.4 miles from Sullivan Sq (Orange Line) and 0.5 miles from East Somerville (Green Line). Enjoy restaurants & shopping at Hood Park, Assembly Row or Encore nearby!
| Date | Buyer | Sale Price | Title Company |
|---|---|---|---|
| Dineva Vanya | $268,000 | -- | |
| Yang Shang-Yu S | $228,500 | -- | |
| Jepson Elizabeth | $218,000 | -- |
| Date | Status | Borrower | Loan Amount |
|---|---|---|---|
| Open | Dineva Vanya | $201,000 | |
| Previous Owner | Yang Shang-Yu S | $170,000 | |
| Previous Owner | Jepson Elizabeth | $196,200 |
| Date | Event | Price | List to Sale | Price per Sq Ft | Prior Sale |
|---|---|---|---|---|---|
| 08/15/2025 08/15/25 | Rented | $2,400 | -7.7% | -- | |
| 08/08/2025 08/08/25 | Under Contract | -- | -- | -- | |
| 07/17/2025 07/17/25 | Price Changed | $2,600 | -3.7% | $4 / Sq Ft | |
| 06/23/2025 06/23/25 | Price Changed | $2,700 | -3.6% | $4 / Sq Ft | |
| 05/20/2025 05/20/25 | For Rent | $2,800 | -3.4% | -- | |
| 09/17/2024 09/17/24 | Rented | $2,900 | 0.0% | -- | |
| 09/10/2024 09/10/24 | Under Contract | -- | -- | -- | |
| 08/21/2024 08/21/24 | Price Changed | $2,900 | -6.5% | $5 / Sq Ft | |
| 08/14/2024 08/14/24 | Price Changed | $3,100 | -6.1% | $5 / Sq Ft | |
| 07/30/2024 07/30/24 | For Rent | $3,300 | 0.0% | -- | |
| 05/06/2013 05/06/13 | Sold | $268,000 | +3.5% | $439 / Sq Ft | View Prior Sale |
| 04/26/2013 04/26/13 | Pending | -- | -- | -- | |
| 03/15/2013 03/15/13 | For Sale | $259,000 | +13.3% | $425 / Sq Ft | |
| 09/14/2012 09/14/12 | Sold | $228,500 | -4.4% | $375 / Sq Ft | View Prior Sale |
| 08/17/2012 08/17/12 | Pending | -- | -- | -- | |
| 07/27/2012 07/27/12 | Price Changed | $239,000 | -2.4% | $392 / Sq Ft | |
| 06/21/2012 06/21/12 | For Sale | $244,900 | -- | $401 / Sq Ft |
| Year | Tax Paid | Tax Assessment Tax Assessment Total Assessment is a certain percentage of the fair market value that is determined by local assessors to be the total taxable value of land and additions on the property. | Land | Improvement |
|---|---|---|---|---|
| 2025 | $5,327 | $460,000 | $0 | $460,000 |
| 2024 | $4,988 | $457,600 | $0 | $457,600 |
| 2023 | $4,767 | $443,900 | $0 | $443,900 |
| 2022 | $4,645 | $426,900 | $0 | $426,900 |
| 2021 | $4,555 | $426,900 | $0 | $426,900 |
| 2020 | $4,156 | $393,600 | $0 | $393,600 |
| 2019 | $3,704 | $351,400 | $0 | $351,400 |
| 2018 | $3,506 | $334,500 | $0 | $334,500 |
| 2017 | $3,407 | $321,700 | $0 | $321,700 |
| 2016 | $3,436 | $312,400 | $0 | $312,400 |
| 2015 | $3,221 | $266,000 | $0 | $266,000 |
| 2014 | $3,070 | $244,000 | $0 | $244,000 |
Landlord's Agent in 2025
Lindsay Higgins
The Market
(857) 201-2461
17 Total Sales
Seller's Agent in 2013
Elizabeth Gibby
The Charles Realty
(617) 595-5343
22 Total Sales
Buyer's Agent in 2013
The Mavroules Team
Good Deeds Realty Partners
(781) 866-6195
128 Total Sales
Seller's Agent in 2012
Bill Skerry
Keller Williams Realty
(617) 877-7529
64 Total Sales
Source: MLS Property Information Network (MLS PIN)
MLS Number: 73377836
APN: CHAR-000000-000002-002057-000006
Disclaimer: Certain information contained herein is derived from information provided by parties other than Homes.com. All information provided is deemed reliable, but is not guaranteed to be accurate and should be independently verified.
![]() The property listing data and information, or the Images, set forth herein were provided to MLS Property Information Network, Inc. from third party sources, including sellers, lessors and public records, and were compiled by MLS Property Information Network, Inc. The property listing data and information, and the Images, are for the personal, non-commercial use of consumers having a good faith interest in purchasing or leasing listed properties of the type displayed to them and may not be used for any purpose other than to identify prospective properties which such consumers may have a good faith interest in purchasing or leasing. MLS Property Information Network, Inc. and its subscribers disclaim any and all representations and warranties as to the accuracy of the property listing data and information, or as to the accuracy of any of the Images, set forth herein.
The property listing data and information, or the Images, set forth herein were provided to MLS Property Information Network, Inc. from third party sources, including sellers, lessors and public records, and were compiled by MLS Property Information Network, Inc. The property listing data and information, and the Images, are for the personal, non-commercial use of consumers having a good faith interest in purchasing or leasing listed properties of the type displayed to them and may not be used for any purpose other than to identify prospective properties which such consumers may have a good faith interest in purchasing or leasing. MLS Property Information Network, Inc. and its subscribers disclaim any and all representations and warranties as to the accuracy of the property listing data and information, or as to the accuracy of any of the Images, set forth herein.