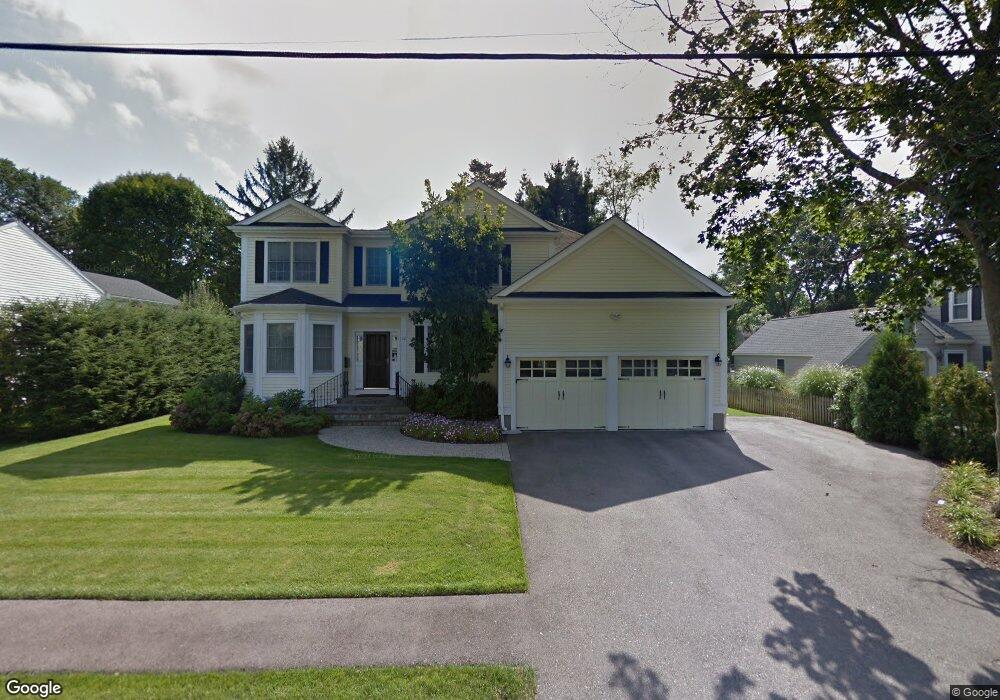
32 Pilgrim Rd Unit 1 Needham, MA 02492
Estimated Value: $2,026,000 - $2,214,000
3
Beds
2
Baths
2,000
Sq Ft
$1,067/Sq Ft
Est. Value
About This Home
This home is located at 32 Pilgrim Rd Unit 1, Needham, MA 02492 and is currently estimated at $2,134,128, approximately $1,067 per square foot. 32 Pilgrim Rd Unit 1 is a home located in Norfolk County with nearby schools including Newman Elementary School, High Rock Middle School, and Pollard Middle School.
Ownership History
Date
Name
Owned For
Owner Type
Purchase Details
Closed on
Dec 3, 2015
Sold by
Chen Anthony D and Kim Mi R
Bought by
Kim Mi R
Current Estimated Value
Purchase Details
Closed on
Nov 14, 2014
Sold by
Finkelstein Gerald L and Finkelstein Jill G
Bought by
Chen Anthony D and Kim Mi R
Home Financials for this Owner
Home Financials are based on the most recent Mortgage that was taken out on this home.
Original Mortgage
$903,600
Interest Rate
4.17%
Mortgage Type
Purchase Money Mortgage
Purchase Details
Closed on
Oct 28, 2005
Sold by
Daly Lisa and Daly Thomas J
Bought by
Finkelstein Gerald L and Finkelstein Jill G
Home Financials for this Owner
Home Financials are based on the most recent Mortgage that was taken out on this home.
Original Mortgage
$880,000
Interest Rate
5.79%
Mortgage Type
Purchase Money Mortgage
Purchase Details
Closed on
May 29, 1998
Sold by
Sutherland Eric and Sutherland Roberta
Bought by
Daly Thomas J and Daly Lisa
Create a Home Valuation Report for This Property
The Home Valuation Report is an in-depth analysis detailing your home's value as well as a comparison with similar homes in the area
Home Values in the Area
Average Home Value in this Area
Purchase History
| Date | Buyer | Sale Price | Title Company |
|---|---|---|---|
| Kim Mi R | -- | -- | |
| Kim Mi R | -- | -- | |
| Kim Mi R | -- | -- | |
| Chen Anthony D | $1,129,500 | -- | |
| Chen Anthony D | $1,129,500 | -- | |
| Finkelstein Gerald L | $555,000 | -- | |
| Finkelstein Gerald L | $555,000 | -- | |
| Daly Thomas J | $295,000 | -- | |
| Daly Thomas J | $295,000 | -- |
Source: Public Records
Mortgage History
| Date | Status | Borrower | Loan Amount |
|---|---|---|---|
| Previous Owner | Chen Anthony D | $903,600 | |
| Previous Owner | Finkelstein Gerald L | $880,000 |
Source: Public Records
Tax History
| Year | Tax Paid | Tax Assessment Tax Assessment Total Assessment is a certain percentage of the fair market value that is determined by local assessors to be the total taxable value of land and additions on the property. | Land | Improvement |
|---|---|---|---|---|
| 2025 | $20,444 | $1,928,700 | $796,100 | $1,132,600 |
| 2024 | $19,830 | $1,583,900 | $574,400 | $1,009,500 |
| 2023 | $19,632 | $1,505,500 | $574,400 | $931,100 |
| 2022 | $18,642 | $1,394,300 | $512,900 | $881,400 |
| 2021 | $18,168 | $1,394,300 | $512,900 | $881,400 |
| 2020 | $16,819 | $1,346,600 | $512,900 | $833,700 |
| 2019 | $15,855 | $1,279,700 | $466,300 | $813,400 |
| 2018 | $15,203 | $1,279,700 | $466,300 | $813,400 |
| 2017 | $14,025 | $1,179,600 | $466,300 | $713,300 |
| 2016 | $16,313 | $1,413,600 | $466,300 | $947,300 |
| 2015 | $15,960 | $1,413,600 | $466,300 | $947,300 |
| 2014 | $15,254 | $1,310,500 | $405,500 | $905,000 |
Source: Public Records
Map
Nearby Homes
- 37 Standish Rd
- 15 Mackintosh Ave
- 21 Brewster Dr
- 19 Mason Rd
- 333 Cartwright Rd
- 170 Benvenue St
- 15 Great Plain Ave
- 15 Alden Rd
- 52 Hancock Rd
- 620 High Rock St
- 3 Hancock Rd
- 102 Jarvis Cir Unit 102
- 20 Arden Rd
- 222 Grove St
- 189 Bridle Trail Rd
- 81 Parish Rd
- 36 Eliot Rd
- 34 Pershing Rd
- 37 Carleton Dr
- 85 Grove St Unit 311
Your Personal Tour Guide
Ask me questions while you tour the home.