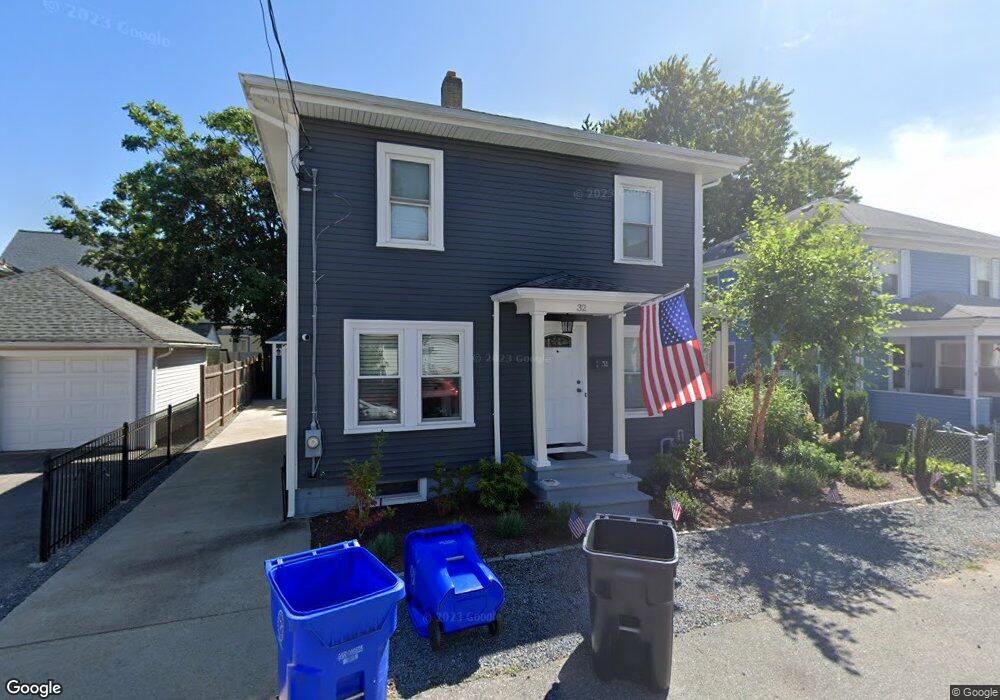
32 Pine St Riverside, RI 02915
Riverside NeighborhoodEstimated Value: $388,000 - $418,600
3
Beds
2
Baths
1,640
Sq Ft
$246/Sq Ft
Est. Value
About This Home
This home is located at 32 Pine St, Riverside, RI 02915 and is currently estimated at $403,650, approximately $246 per square foot. 32 Pine St is a home located in Providence County with nearby schools including East Providence High School, St Mary Academy-Bay View, and St Luke Elementary School.
Ownership History
Date
Name
Owned For
Owner Type
Purchase Details
Closed on
Jan 6, 2010
Sold by
Schneider Josephine A
Bought by
Sellers Sarah L
Current Estimated Value
Home Financials for this Owner
Home Financials are based on the most recent Mortgage that was taken out on this home.
Original Mortgage
$112,917
Outstanding Balance
$73,196
Interest Rate
4.78%
Mortgage Type
Purchase Money Mortgage
Estimated Equity
$330,454
Create a Home Valuation Report for This Property
The Home Valuation Report is an in-depth analysis detailing your home's value as well as a comparison with similar homes in the area
Home Values in the Area
Average Home Value in this Area
Purchase History
| Date | Buyer | Sale Price | Title Company |
|---|---|---|---|
| Sellers Sarah L | $115,000 | -- | |
| Sellers Sarah L | $115,000 | -- |
Source: Public Records
Mortgage History
| Date | Status | Borrower | Loan Amount |
|---|---|---|---|
| Open | Sellers Sarah L | $16,000 | |
| Open | Sellers Sarah L | $112,917 | |
| Closed | Sellers Sarah L | $112,917 | |
| Previous Owner | Sellers Sarah L | $74,000 |
Source: Public Records
Tax History
| Year | Tax Paid | Tax Assessment Tax Assessment Total Assessment is a certain percentage of the fair market value that is determined by local assessors to be the total taxable value of land and additions on the property. | Land | Improvement |
|---|---|---|---|---|
| 2025 | $4,479 | $342,700 | $81,900 | $260,800 |
| 2024 | $4,078 | $266,000 | $68,200 | $197,800 |
| 2023 | $3,926 | $266,000 | $68,200 | $197,800 |
| 2022 | $3,740 | $171,100 | $50,400 | $120,700 |
| 2021 | $3,679 | $171,100 | $47,800 | $123,300 |
| 2020 | $3,523 | $171,100 | $47,800 | $123,300 |
| 2019 | $3,425 | $171,100 | $47,800 | $123,300 |
| 2018 | $3,318 | $145,000 | $47,900 | $97,100 |
| 2017 | $3,244 | $145,000 | $47,900 | $97,100 |
| 2016 | $3,228 | $145,000 | $47,900 | $97,100 |
| 2015 | $3,234 | $140,900 | $48,800 | $92,100 |
| 2014 | $3,234 | $140,900 | $48,800 | $92,100 |
Source: Public Records
Map
Nearby Homes
- 33 Pine St Unit 35
- 28 Jefferson Ave
- 72 Stowe Ave
- 129 Shore Rd
- 103 Burnside Ave
- 25 Arnold St
- 151 Willett Ave Unit 2
- 43 Bullocks Point Ave Unit 4A
- 41 White Ave
- 33 Bullocks Point Ave Unit 5C
- 25 Bullocks Point Ave Unit 5C
- 6 Fuller Ave
- 25 Winslow St
- 14 Winthrop St
- 14 Benedict St
- 10 Booth Ave
- 15 Claire St
- 0 Carousel Dr
- 85 Hilton Ave
- 916 Bullocks Pt Ave
Your Personal Tour Guide
Ask me questions while you tour the home.