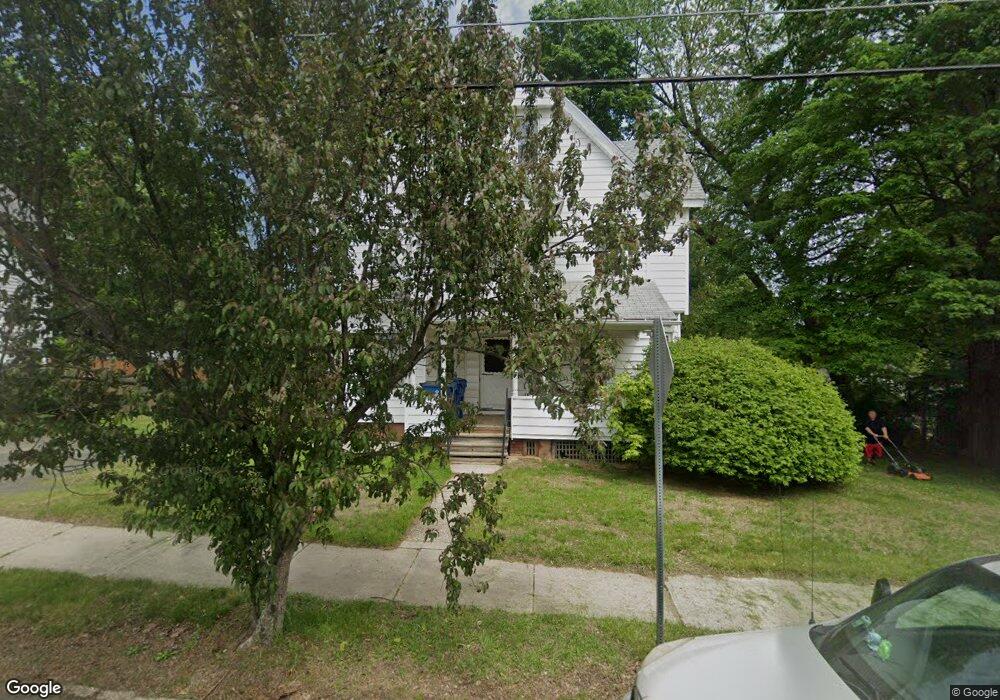
32 Pine St West Springfield, MA 01089
Estimated Value: $336,000 - $381,000
4
Beds
2
Baths
2,202
Sq Ft
$165/Sq Ft
Est. Value
About This Home
This home is located at 32 Pine St, West Springfield, MA 01089 and is currently estimated at $363,462, approximately $165 per square foot. 32 Pine St is a home located in Hampden County with nearby schools including West Springfield High School and St Thomas The Apostle School.
Ownership History
Date
Name
Owned For
Owner Type
Purchase Details
Closed on
Oct 20, 2023
Sold by
Dalise Ralph T
Bought by
Chiba Jessica L
Current Estimated Value
Purchase Details
Closed on
Jul 28, 2017
Sold by
Ottley Laura L and Quagliesi Marian S
Bought by
Dalise Ralph T
Home Financials for this Owner
Home Financials are based on the most recent Mortgage that was taken out on this home.
Original Mortgage
$229,500
Interest Rate
3.91%
Mortgage Type
Reverse Mortgage Home Equity Conversion Mortgage
Create a Home Valuation Report for This Property
The Home Valuation Report is an in-depth analysis detailing your home's value as well as a comparison with similar homes in the area
Home Values in the Area
Average Home Value in this Area
Purchase History
| Date | Buyer | Sale Price | Title Company |
|---|---|---|---|
| Chiba Jessica L | -- | None Available | |
| Dalise Ralph T | -- | -- | |
| Dalise Ralph T | -- | -- |
Source: Public Records
Mortgage History
| Date | Status | Borrower | Loan Amount |
|---|---|---|---|
| Previous Owner | Dalise Ralph T | $229,500 |
Source: Public Records
Tax History
| Year | Tax Paid | Tax Assessment Tax Assessment Total Assessment is a certain percentage of the fair market value that is determined by local assessors to be the total taxable value of land and additions on the property. | Land | Improvement |
|---|---|---|---|---|
| 2025 | $4,516 | $303,700 | $99,700 | $204,000 |
| 2024 | $4,228 | $285,500 | $99,700 | $185,800 |
| 2023 | $3,942 | $253,700 | $97,500 | $156,200 |
| 2022 | $3,546 | $225,000 | $88,500 | $136,500 |
| 2021 | $3,358 | $198,700 | $82,100 | $116,600 |
| 2020 | $3,376 | $198,700 | $82,100 | $116,600 |
| 2019 | $3,370 | $198,700 | $82,100 | $116,600 |
| 2018 | $3,388 | $198,700 | $82,100 | $116,600 |
| 2017 | $3,376 | $198,000 | $82,100 | $115,900 |
| 2016 | $3,279 | $193,000 | $77,100 | $115,900 |
| 2015 | $3,218 | $189,400 | $75,700 | $113,700 |
| 2014 | $781 | $189,400 | $75,700 | $113,700 |
Source: Public Records
Map
Nearby Homes
Your Personal Tour Guide
Ask me questions while you tour the home.