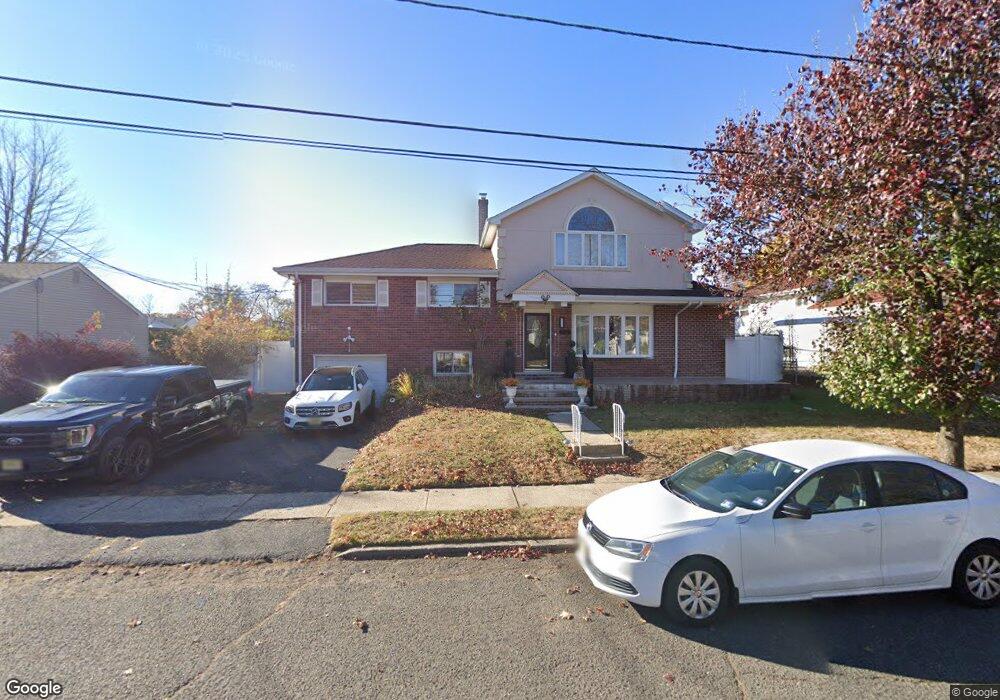
32 Pleasant St Dumont, NJ 07628
Estimated Value: $794,622
4
Beds
3
Baths
2,520
Sq Ft
$315/Sq Ft
Est. Value
About This Home
This home is located at 32 Pleasant St, Dumont, NJ 07628 and is currently priced at $794,622, approximately $315 per square foot. 32 Pleasant St is a home located in Bergen County with nearby schools including Dumont High School.
Ownership History
Date
Name
Owned For
Owner Type
Purchase Details
Closed on
Jun 4, 2021
Sold by
Thompson Gloria and Robinson Danielle J
Bought by
Catugda Gerald and Catugda Fleur
Current Estimated Value
Home Financials for this Owner
Home Financials are based on the most recent Mortgage that was taken out on this home.
Original Mortgage
$631,960
Outstanding Balance
$572,161
Interest Rate
2.9%
Mortgage Type
VA
Purchase Details
Closed on
Sep 30, 1997
Sold by
Thompson Henry R
Bought by
Thompson Henry and Thompson Gloria
Create a Home Valuation Report for This Property
The Home Valuation Report is an in-depth analysis detailing your home's value as well as a comparison with similar homes in the area
Home Values in the Area
Average Home Value in this Area
Purchase History
| Date | Buyer | Sale Price | Title Company |
|---|---|---|---|
| Catugda Gerald | $610,000 | First American Title Ins Co | |
| Thompson Henry | -- | -- |
Source: Public Records
Mortgage History
| Date | Status | Borrower | Loan Amount |
|---|---|---|---|
| Open | Catugda Gerald | $631,960 |
Source: Public Records
Tax History
| Year | Tax Paid | Tax Assessment Tax Assessment Total Assessment is a certain percentage of the fair market value that is determined by local assessors to be the total taxable value of land and additions on the property. | Land | Improvement |
|---|---|---|---|---|
| 2025 | $16,284 | $641,000 | $330,600 | $310,400 |
| 2024 | $16,284 | $410,700 | $176,400 | $234,300 |
Source: Public Records
Map
Nearby Homes