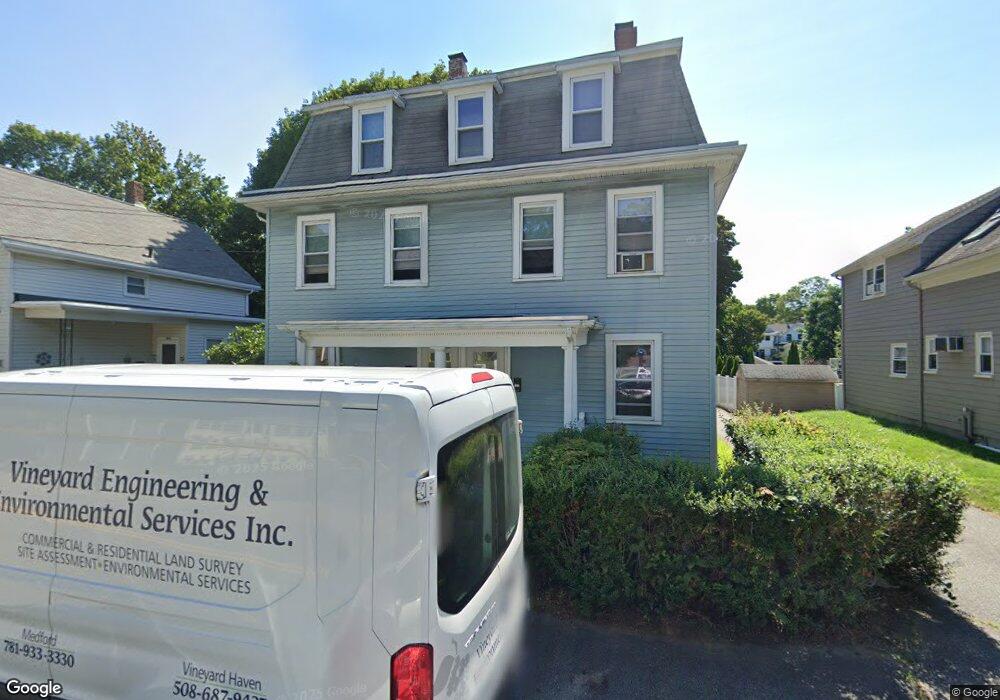
32 Pond St Stoneham, MA 02180
Haywardville NeighborhoodEstimated Value: $821,000 - $931,000
6
Beds
2
Baths
2,878
Sq Ft
$304/Sq Ft
Est. Value
About This Home
This home is located at 32 Pond St, Stoneham, MA 02180 and is currently estimated at $874,920, approximately $304 per square foot. 32 Pond St is a home located in Middlesex County with nearby schools including Stoneham High School, Greater Boston Academy, and St. Patrick Elementary School.
Ownership History
Date
Name
Owned For
Owner Type
Purchase Details
Closed on
Jun 27, 1997
Sold by
Alexander Davis B and Alexander Kathleen H
Bought by
Palacios Roberto A and Palacios White-Palacios G
Current Estimated Value
Home Financials for this Owner
Home Financials are based on the most recent Mortgage that was taken out on this home.
Original Mortgage
$171,000
Interest Rate
7.81%
Mortgage Type
Purchase Money Mortgage
Create a Home Valuation Report for This Property
The Home Valuation Report is an in-depth analysis detailing your home's value as well as a comparison with similar homes in the area
Home Values in the Area
Average Home Value in this Area
Purchase History
| Date | Buyer | Sale Price | Title Company |
|---|---|---|---|
| Palacios Roberto A | $180,000 | -- |
Source: Public Records
Mortgage History
| Date | Status | Borrower | Loan Amount |
|---|---|---|---|
| Open | Palacios Roberto A | $315,000 | |
| Closed | Palacios Roberto A | $73,500 | |
| Closed | Palacios Roberto A | $152,000 | |
| Closed | Palacios Roberto A | $171,000 |
Source: Public Records
Tax History Compared to Growth
Tax History
| Year | Tax Paid | Tax Assessment Tax Assessment Total Assessment is a certain percentage of the fair market value that is determined by local assessors to be the total taxable value of land and additions on the property. | Land | Improvement |
|---|---|---|---|---|
| 2025 | $7,546 | $737,600 | $346,600 | $391,000 |
| 2024 | $7,527 | $710,800 | $319,200 | $391,600 |
| 2023 | $7,586 | $683,400 | $291,800 | $391,600 |
| 2022 | $6,830 | $656,100 | $264,500 | $391,600 |
| 2021 | $14,073 | $619,700 | $228,000 | $391,700 |
| 2020 | $6,553 | $607,300 | $217,100 | $390,200 |
| 2019 | $5,870 | $523,200 | $202,300 | $320,900 |
| 2018 | $5,637 | $481,400 | $199,000 | $282,400 |
| 2017 | $11,940 | $409,100 | $177,800 | $231,300 |
| 2016 | $4,958 | $390,400 | $177,800 | $212,600 |
| 2015 | $5,063 | $390,700 | $160,100 | $230,600 |
| 2014 | $4,954 | $367,200 | $142,300 | $224,900 |
Source: Public Records
Map
Nearby Homes
- 20 Pond St
- 137 Franklin St Unit 102
- 35 Wright St
- 17 Franklin St
- 7 Carol St
- 159 Franklin St Unit D2
- 159 Franklin St Unit C2
- 159 Franklin St Unit E6
- 588 Main St Unit 3C
- 5 Rockville Park
- 5-9 Rockville Park
- 146 Marble St Unit 408
- 12 Cottage St
- 39 Tamarock Terrace
- 21 Tremont St Unit A
- 1 Tremont St
- 3 Veterans Ln
- 200 Ledgewood Dr Unit 505
- 100 Ledgewood Dr Unit 117
- 49 Butler Ave