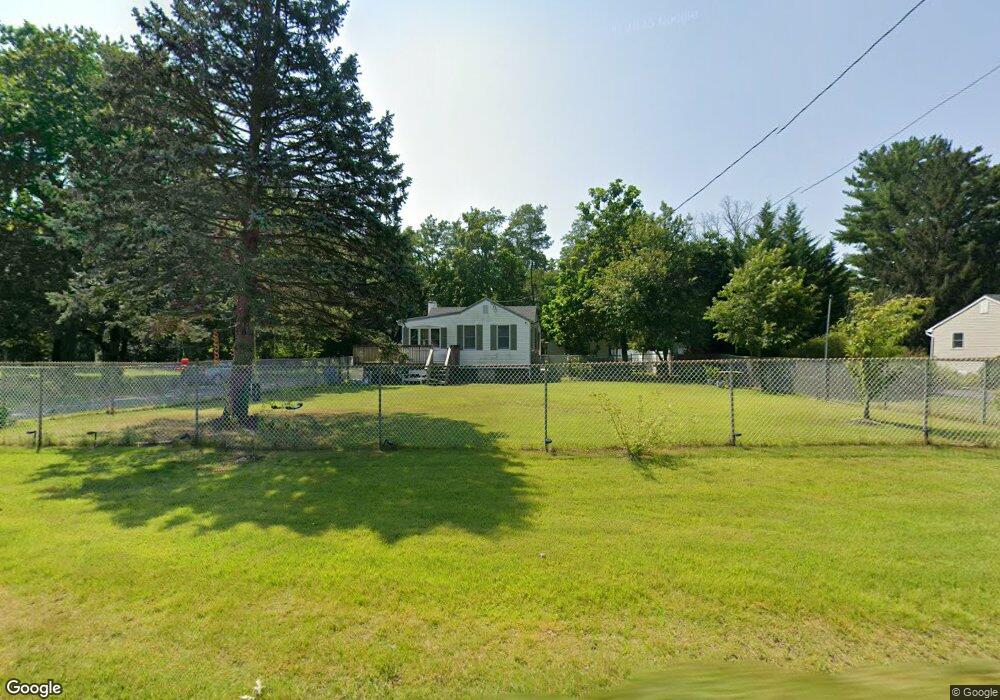
32 Poor Farm Rd Old Bridge, NJ 08857
Estimated Value: $399,563 - $515,000
2
Beds
1
Bath
912
Sq Ft
$512/Sq Ft
Est. Value
About This Home
This home is located at 32 Poor Farm Rd, Old Bridge, NJ 08857 and is currently estimated at $467,141, approximately $512 per square foot. 32 Poor Farm Rd is a home located in Middlesex County with nearby schools including Old Bridge High School, Minding Miracles Learning Center, and New Road School of Parlin.
Ownership History
Date
Name
Owned For
Owner Type
Purchase Details
Closed on
May 18, 2021
Sold by
Nr Llc
Bought by
Santiago Amaro Jose O and Jimenez Marycell
Current Estimated Value
Home Financials for this Owner
Home Financials are based on the most recent Mortgage that was taken out on this home.
Original Mortgage
$260,000
Outstanding Balance
$232,819
Interest Rate
2.9%
Mortgage Type
New Conventional
Estimated Equity
$234,322
Purchase Details
Closed on
Mar 18, 2021
Sold by
Gallucci Barbara T and Gallucci Joseph C
Bought by
N R Llc
Purchase Details
Closed on
Oct 2, 1979
Bought by
Gallucci Barbara
Create a Home Valuation Report for This Property
The Home Valuation Report is an in-depth analysis detailing your home's value as well as a comparison with similar homes in the area
Home Values in the Area
Average Home Value in this Area
Purchase History
| Date | Buyer | Sale Price | Title Company |
|---|---|---|---|
| Santiago Amaro Jose O | $325,000 | Green Label Title | |
| Santiago-Amaro Jose O | $325,000 | Green Label Title | |
| N R Llc | -- | None Available | |
| N R Llc | -- | None Listed On Document | |
| Gallucci Barbara | $38,500 | -- |
Source: Public Records
Mortgage History
| Date | Status | Borrower | Loan Amount |
|---|---|---|---|
| Open | Santiago-Amaro Jose O | $260,000 | |
| Closed | Santiago-Amaro Jose O | $260,000 |
Source: Public Records
Tax History
| Year | Tax Paid | Tax Assessment Tax Assessment Total Assessment is a certain percentage of the fair market value that is determined by local assessors to be the total taxable value of land and additions on the property. | Land | Improvement |
|---|---|---|---|---|
| 2025 | $5,536 | $94,100 | $57,600 | $36,500 |
| 2024 | $5,324 | $94,100 | $57,600 | $36,500 |
| 2023 | $5,324 | $94,100 | $57,600 | $36,500 |
| 2022 | $5,205 | $94,100 | $57,600 | $36,500 |
| 2021 | $3,219 | $94,100 | $57,600 | $36,500 |
| 2020 | $4,795 | $94,100 | $57,600 | $36,500 |
| 2019 | $4,963 | $94,100 | $57,600 | $36,500 |
| 2018 | $4,660 | $94,100 | $57,600 | $36,500 |
| 2017 | $4,512 | $94,100 | $57,600 | $36,500 |
| 2016 | $4,673 | $94,100 | $57,600 | $36,500 |
| 2015 | $4,338 | $94,100 | $57,600 | $36,500 |
| 2014 | $4,265 | $94,100 | $57,600 | $36,500 |
Source: Public Records
Map
Nearby Homes
Your Personal Tour Guide
Ask me questions while you tour the home.