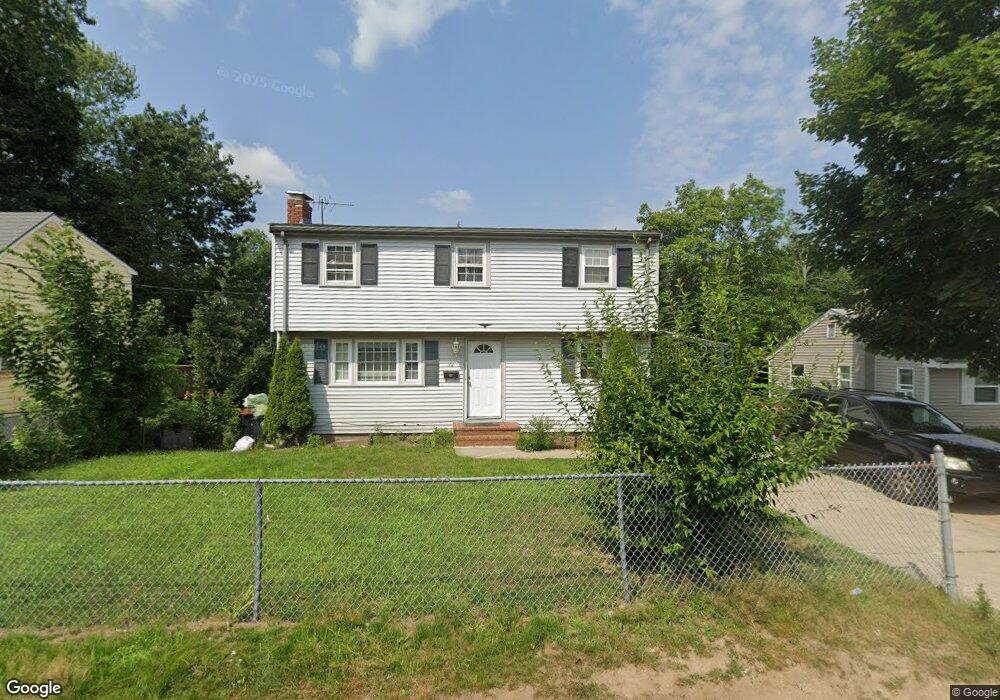
32 Prince St Unit 1 Brockton, MA 02302
Estimated Value: $483,000 - $544,000
5
Beds
2
Baths
1,568
Sq Ft
$326/Sq Ft
Est. Value
About This Home
This home is located at 32 Prince St Unit 1, Brockton, MA 02302 and is currently estimated at $510,698, approximately $325 per square foot. 32 Prince St Unit 1 is a home located in Plymouth County with nearby schools including Brookfield Elementary School, Downey Elementary School, and Ashfield Middle School.
Ownership History
Date
Name
Owned For
Owner Type
Purchase Details
Closed on
Aug 24, 2020
Sold by
Salomon Marie K
Bought by
Saloman Ft
Current Estimated Value
Purchase Details
Closed on
Jun 28, 1999
Sold by
Toussaint Jean W and Florival Sherman
Bought by
Salomon Marie K
Purchase Details
Closed on
Jun 30, 1995
Sold by
Karas Edward F and Karas Frances M
Bought by
Toussaint Jean W and Florival Sherman
Create a Home Valuation Report for This Property
The Home Valuation Report is an in-depth analysis detailing your home's value as well as a comparison with similar homes in the area
Home Values in the Area
Average Home Value in this Area
Purchase History
| Date | Buyer | Sale Price | Title Company |
|---|---|---|---|
| Saloman Ft | -- | None Available | |
| Salomon Marie K | $101,000 | -- | |
| Toussaint Jean W | $101,000 | -- |
Source: Public Records
Mortgage History
| Date | Status | Borrower | Loan Amount |
|---|---|---|---|
| Previous Owner | Toussaint Jean W | $157,000 | |
| Previous Owner | Toussaint Jean W | $135,000 | |
| Previous Owner | Toussaint Jean W | $10,702 |
Source: Public Records
Tax History Compared to Growth
Tax History
| Year | Tax Paid | Tax Assessment Tax Assessment Total Assessment is a certain percentage of the fair market value that is determined by local assessors to be the total taxable value of land and additions on the property. | Land | Improvement |
|---|---|---|---|---|
| 2025 | $5,612 | $463,400 | $143,900 | $319,500 |
| 2024 | $5,242 | $436,100 | $143,900 | $292,200 |
| 2023 | $5,043 | $388,500 | $108,600 | $279,900 |
| 2022 | $4,917 | $352,000 | $98,600 | $253,400 |
| 2021 | $4,605 | $317,600 | $90,900 | $226,700 |
| 2020 | $4,401 | $290,500 | $87,400 | $203,100 |
| 2019 | $4,350 | $279,900 | $80,700 | $199,200 |
| 2018 | $3,951 | $246,000 | $80,700 | $165,300 |
| 2017 | $3,643 | $226,300 | $80,700 | $145,600 |
| 2016 | $3,323 | $191,400 | $76,900 | $114,500 |
| 2015 | $3,309 | $182,300 | $76,900 | $105,400 |
| 2014 | $3,379 | $186,400 | $76,900 | $109,500 |
Source: Public Records
Map
Nearby Homes