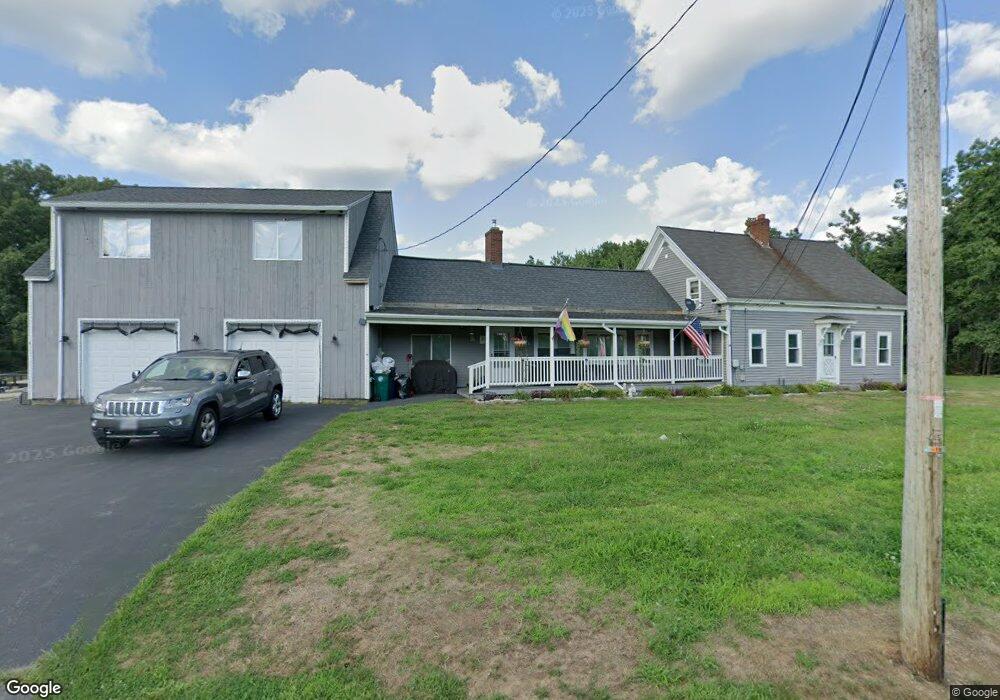
32 Proctor Rd Biddeford, ME 04005
South Biddeford NeighborhoodEstimated Value: $505,000 - $586,125
2
Beds
2
Baths
1,680
Sq Ft
$329/Sq Ft
Est. Value
About This Home
This home is located at 32 Proctor Rd, Biddeford, ME 04005 and is currently estimated at $552,281, approximately $328 per square foot. 32 Proctor Rd is a home located in York County with nearby schools including John F Kennedy Memorial School, Biddeford Primary School, and Biddeford Intermediate School.
Ownership History
Date
Name
Owned For
Owner Type
Purchase Details
Closed on
Oct 30, 2024
Sold by
Ruck Norman R Est and Ruck
Bought by
Ruck Lance C and Ruck Wade M
Current Estimated Value
Purchase Details
Closed on
Jul 31, 2023
Sold by
Ruck Norman R Est and Ruck
Bought by
Ruck Wade M and Ruck Lance C
Create a Home Valuation Report for This Property
The Home Valuation Report is an in-depth analysis detailing your home's value as well as a comparison with similar homes in the area
Home Values in the Area
Average Home Value in this Area
Purchase History
| Date | Buyer | Sale Price | Title Company |
|---|---|---|---|
| Ruck Lance C | -- | None Available | |
| Ruck Lance C | -- | None Available | |
| Ruck Wade M | -- | None Available | |
| Ruck Wade M | -- | None Available | |
| Ruck Wade M | -- | None Available |
Source: Public Records
Tax History
| Year | Tax Paid | Tax Assessment Tax Assessment Total Assessment is a certain percentage of the fair market value that is determined by local assessors to be the total taxable value of land and additions on the property. | Land | Improvement |
|---|---|---|---|---|
| 2024 | $6,786 | $477,200 | $171,200 | $306,000 |
| 2023 | $6,261 | $477,200 | $171,200 | $306,000 |
| 2022 | $6,144 | $374,400 | $96,000 | $278,400 |
| 2021 | $5,784 | $317,300 | $80,000 | $237,300 |
| 2020 | $5,736 | $286,100 | $68,100 | $218,000 |
| 2019 | $5,716 | $286,100 | $68,100 | $218,000 |
| 2018 | $5,636 | $286,100 | $68,100 | $218,000 |
| 2017 | $5,403 | $269,200 | $68,100 | $201,100 |
| 2016 | $5,346 | $269,200 | $68,100 | $201,100 |
| 2015 | $5,047 | $269,200 | $68,100 | $201,100 |
| 2014 | $4,922 | $269,200 | $68,100 | $201,100 |
| 2013 | -- | $255,600 | $64,500 | $191,100 |
Source: Public Records
Map
Nearby Homes
- 6 Proctor Rd Unit B
- 6 Proctor Rd Unit A
- 10 Tow Rd
- 109 Proctor Rd
- 5 Moxie Ln
- 0 Cole Benson Rd
- 13 Benson
- 13 Commodore Dr
- 2 Burleigh Ln
- 74 Guinea Rd
- 400 West St
- Lot 10 Jasper Ln
- Lot 4 Jasper Ln
- Lot 3 Jasper Ln
- Lot 12 Jasper Ln
- Lot 2 Jasper Ln
- Lot 9 Jasper Ln
- Lot 11 Jasper Ln
- Lot 5 Jasper Ln
- 9 Jasper Ln
Your Personal Tour Guide
Ask me questions while you tour the home.