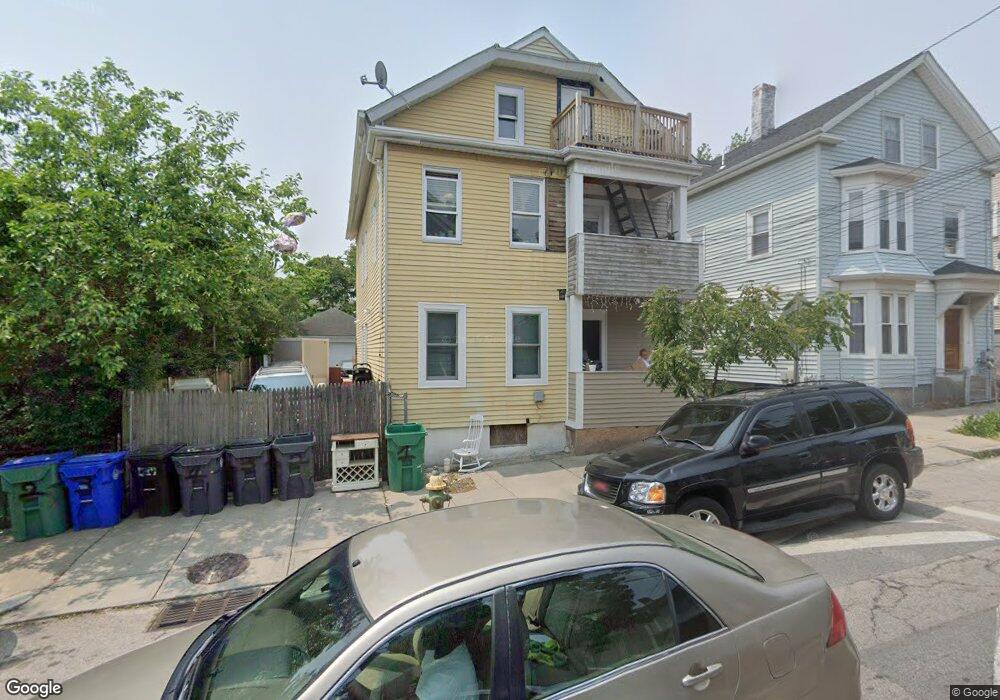
32 Putnam St Providence, RI 02909
Olneyville NeighborhoodEstimated Value: $537,000 - $589,000
8
Beds
3
Baths
2,448
Sq Ft
$231/Sq Ft
Est. Value
About This Home
This home is located at 32 Putnam St, Providence, RI 02909 and is currently estimated at $564,333, approximately $230 per square foot. 32 Putnam St is a home located in Providence County with nearby schools including Asa Messer Elementary School, Charles N. Fortes Elementary School, and Laurel Hill Annex School.
Ownership History
Date
Name
Owned For
Owner Type
Purchase Details
Closed on
Feb 27, 2023
Sold by
Prum Sophorn
Bought by
Prum Sophorn and Prum Vibol
Current Estimated Value
Purchase Details
Closed on
Feb 11, 2009
Sold by
Citifinancial Inc
Bought by
Prum Sophorn
Purchase Details
Closed on
Dec 4, 2006
Sold by
Torres Walquiria
Bought by
Acevedo Candido
Home Financials for this Owner
Home Financials are based on the most recent Mortgage that was taken out on this home.
Original Mortgage
$237,600
Interest Rate
6.36%
Mortgage Type
Purchase Money Mortgage
Purchase Details
Closed on
Sep 29, 2005
Sold by
Jimenez Elvira
Bought by
Torres Walquira
Purchase Details
Closed on
Oct 20, 2000
Sold by
Rodriquez Julio C
Bought by
Jimenez Elvira
Create a Home Valuation Report for This Property
The Home Valuation Report is an in-depth analysis detailing your home's value as well as a comparison with similar homes in the area
Home Values in the Area
Average Home Value in this Area
Purchase History
| Date | Buyer | Sale Price | Title Company |
|---|---|---|---|
| Prum Sophorn | -- | None Available | |
| Prum Sophorn | $52,395 | -- | |
| Acevedo Candido | $297,000 | -- | |
| Torres Walquira | $255,000 | -- | |
| Jimenez Elvira | $72,000 | -- |
Source: Public Records
Mortgage History
| Date | Status | Borrower | Loan Amount |
|---|---|---|---|
| Previous Owner | Jimenez Elvira | $45,000 | |
| Previous Owner | Jimenez Elvira | $240,211 | |
| Previous Owner | Jimenez Elvira | $237,600 |
Source: Public Records
Tax History Compared to Growth
Tax History
| Year | Tax Paid | Tax Assessment Tax Assessment Total Assessment is a certain percentage of the fair market value that is determined by local assessors to be the total taxable value of land and additions on the property. | Land | Improvement |
|---|---|---|---|---|
| 2025 | $6,713 | $479,500 | $147,600 | $331,900 |
| 2024 | $5,406 | $294,600 | $71,800 | $222,800 |
| 2023 | $5,406 | $294,600 | $71,800 | $222,800 |
| 2022 | $5,244 | $294,600 | $71,800 | $222,800 |
| 2021 | $4,288 | $174,600 | $33,500 | $141,100 |
| 2020 | $4,288 | $174,600 | $33,500 | $141,100 |
| 2019 | $4,234 | $172,400 | $33,500 | $138,900 |
| 2018 | $3,477 | $108,800 | $27,600 | $81,200 |
| 2017 | $3,477 | $108,800 | $27,600 | $81,200 |
| 2016 | $3,477 | $108,800 | $27,600 | $81,200 |
| 2015 | $2,883 | $87,100 | $33,200 | $53,900 |
| 2014 | $2,940 | $87,100 | $33,200 | $53,900 |
| 2013 | $2,940 | $87,100 | $33,200 | $53,900 |
Source: Public Records
Map
Nearby Homes