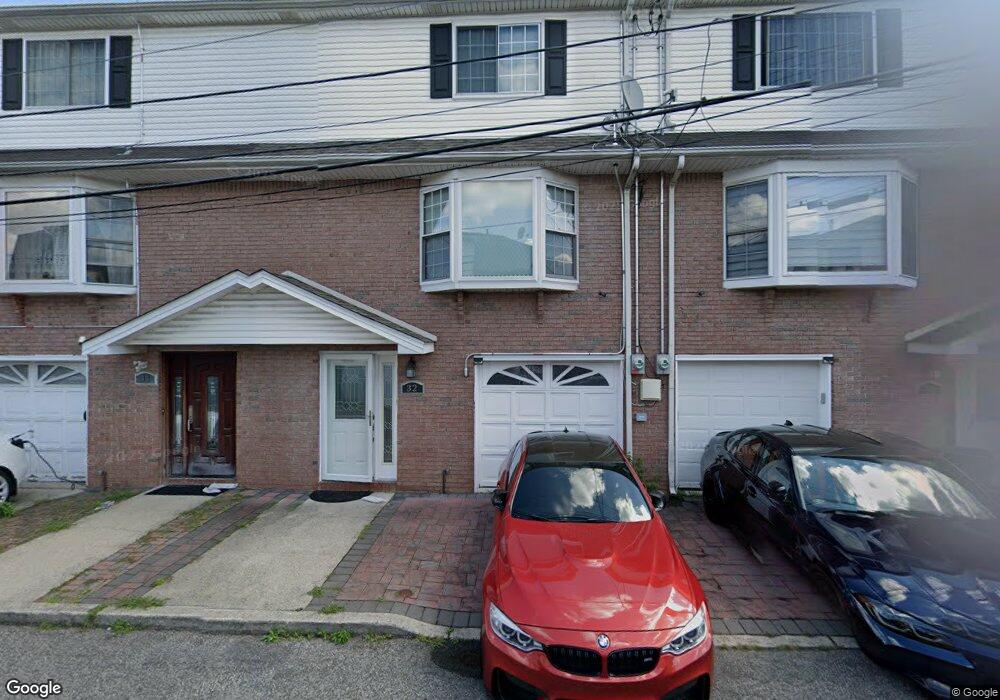
32 Ragazzi Ln Staten Island, NY 10305
South Beach NeighborhoodEstimated Value: $673,841 - $848,000
--
Bed
4
Baths
1,844
Sq Ft
$419/Sq Ft
Est. Value
About This Home
This home is located at 32 Ragazzi Ln, Staten Island, NY 10305 and is currently estimated at $772,710, approximately $419 per square foot. 32 Ragazzi Ln is a home located in Richmond County with nearby schools including P.S. 39 The Francis J. Murphy Jr. School, I.S. 49 Berta A Dreyfus, and Curtis High School.
Ownership History
Date
Name
Owned For
Owner Type
Purchase Details
Closed on
Jun 26, 2018
Sold by
Hassan Mohamed M
Bought by
Hassan Mohamed M and The Mohamed M Hassan Living Tr
Current Estimated Value
Purchase Details
Closed on
Nov 19, 2001
Sold by
Olympia Estates Ii Inc
Bought by
Hassan Mohamed
Home Financials for this Owner
Home Financials are based on the most recent Mortgage that was taken out on this home.
Original Mortgage
$175,000
Outstanding Balance
$68,146
Interest Rate
6.67%
Estimated Equity
$704,564
Create a Home Valuation Report for This Property
The Home Valuation Report is an in-depth analysis detailing your home's value as well as a comparison with similar homes in the area
Home Values in the Area
Average Home Value in this Area
Purchase History
| Date | Buyer | Sale Price | Title Company |
|---|---|---|---|
| Hassan Mohamed M | -- | Regal Title Agency | |
| Hassan Mohamed | $261,000 | -- |
Source: Public Records
Mortgage History
| Date | Status | Borrower | Loan Amount |
|---|---|---|---|
| Open | Hassan Mohamed | $175,000 |
Source: Public Records
Tax History Compared to Growth
Tax History
| Year | Tax Paid | Tax Assessment Tax Assessment Total Assessment is a certain percentage of the fair market value that is determined by local assessors to be the total taxable value of land and additions on the property. | Land | Improvement |
|---|---|---|---|---|
| 2025 | $6,303 | $41,460 | $3,798 | $37,662 |
| 2024 | $4,671 | $35,280 | $4,430 | $30,850 |
| 2023 | $5,947 | $29,608 | $3,996 | $25,612 |
| 2022 | $5,292 | $31,380 | $4,980 | $26,400 |
| 2021 | $5,546 | $33,060 | $4,980 | $28,080 |
| 2020 | $5,551 | $30,660 | $4,980 | $25,680 |
| 2019 | $5,471 | $30,180 | $4,980 | $25,200 |
| 2018 | $5,030 | $24,673 | $4,665 | $20,008 |
| 2017 | $4,745 | $23,277 | $4,655 | $18,622 |
| 2016 | $4,390 | $21,960 | $4,980 | $16,980 |
| 2015 | $4,433 | $23,100 | $4,140 | $18,960 |
| 2014 | $4,433 | $23,100 | $4,140 | $18,960 |
Source: Public Records
Map
Nearby Homes
- 142 Alex Cir
- 14 Ragazzi Ln
- 147 Robin Rd
- 66 Seagate Ct
- 32 Linda Ave Unit 68
- 233 Sand Ln
- 26 Robin Rd
- 71 Windom Ave
- 41 Olympia Blvd
- 44 Olympia Blvd
- 46 Olympia Blvd
- 146 Cedar Ave
- 55 Lansing St
- 26 Guilford St
- 21 Father Capodanno Blvd
- 53 Piave Ave
- 19 Father Capodanno Blvd
- 154 Sand Ln
- 26 Conger St
- 27 Conger St