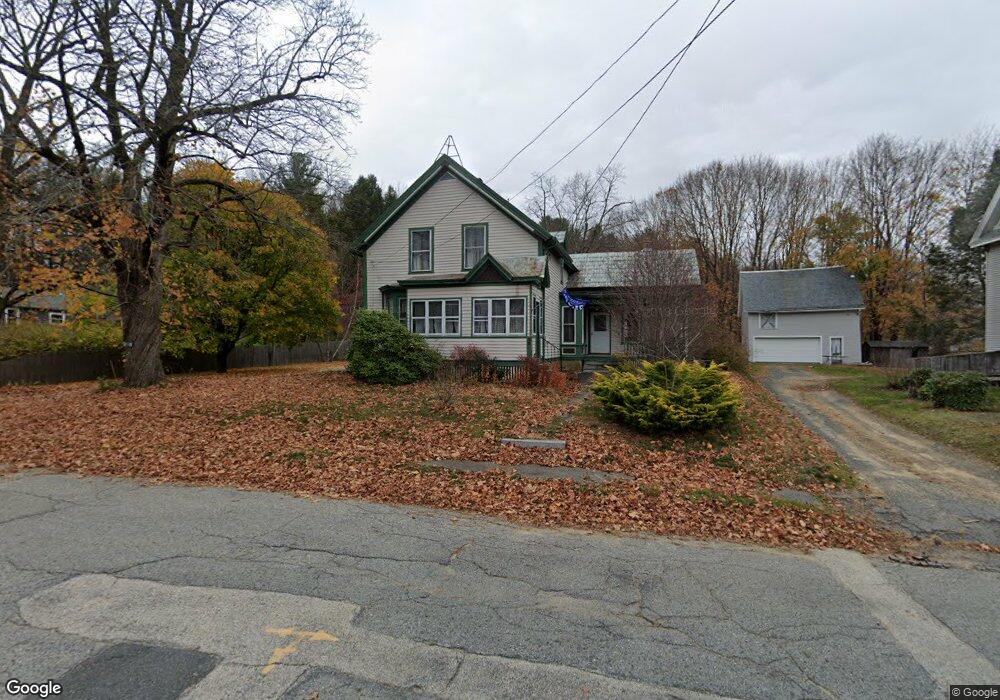
32 Richardson St Warren, MA 01083
Estimated Value: $229,000 - $385,000
3
Beds
1
Bath
1,760
Sq Ft
$170/Sq Ft
Est. Value
About This Home
This home is located at 32 Richardson St, Warren, MA 01083 and is currently estimated at $298,876, approximately $169 per square foot. 32 Richardson St is a home with nearby schools including Quaboag Regional High School.
Ownership History
Date
Name
Owned For
Owner Type
Purchase Details
Closed on
Jul 24, 2023
Sold by
Clark Deborah and Freedom Mortgage Corp
Bought by
Freedom Mortgage Corp
Current Estimated Value
Purchase Details
Closed on
Mar 27, 2015
Sold by
Denehy Rosemary
Bought by
Clark Deborah
Home Financials for this Owner
Home Financials are based on the most recent Mortgage that was taken out on this home.
Original Mortgage
$113,428
Interest Rate
3.68%
Mortgage Type
FHA
Purchase Details
Closed on
Jun 29, 2007
Sold by
Boucher Carolyn N and Boucher Charles E
Bought by
Suprenant Rosemary
Home Financials for this Owner
Home Financials are based on the most recent Mortgage that was taken out on this home.
Original Mortgage
$144,500
Interest Rate
6.24%
Mortgage Type
Purchase Money Mortgage
Create a Home Valuation Report for This Property
The Home Valuation Report is an in-depth analysis detailing your home's value as well as a comparison with similar homes in the area
Home Values in the Area
Average Home Value in this Area
Purchase History
| Date | Buyer | Sale Price | Title Company |
|---|---|---|---|
| Freedom Mortgage Corp | $114,123 | None Available | |
| Freedom Mortgage Corp | $114,123 | None Available | |
| Clark Deborah | $89,000 | -- | |
| Suprenant Rosemary | $170,000 | -- | |
| Suprenant Rosemary | $170,000 | -- |
Source: Public Records
Mortgage History
| Date | Status | Borrower | Loan Amount |
|---|---|---|---|
| Previous Owner | Clark Deborah | $113,428 | |
| Previous Owner | Suprenant Rosemary | $144,500 |
Source: Public Records
Tax History
| Year | Tax Paid | Tax Assessment Tax Assessment Total Assessment is a certain percentage of the fair market value that is determined by local assessors to be the total taxable value of land and additions on the property. | Land | Improvement |
|---|---|---|---|---|
| 2025 | $2,802 | $189,200 | $53,300 | $135,900 |
| 2024 | $2,851 | $189,200 | $53,300 | $135,900 |
| 2023 | $2,801 | $177,300 | $53,300 | $124,000 |
| 2022 | $2,452 | $157,600 | $43,800 | $113,800 |
| 2021 | $4,491 | $150,100 | $41,400 | $108,700 |
| 2020 | $2,378 | $138,600 | $41,400 | $97,200 |
| 2019 | $2,398 | $132,100 | $41,400 | $90,700 |
| 2018 | $0 | $122,300 | $41,400 | $80,900 |
| 2017 | $2,210 | $119,100 | $43,000 | $76,100 |
| 2016 | $2,639 | $133,000 | $41,100 | $91,900 |
| 2015 | $2,406 | $128,300 | $41,100 | $87,200 |
| 2014 | $2,512 | $131,500 | $41,100 | $90,400 |
Source: Public Records
Map
Nearby Homes
- 17 Otis St
- 40 Hillside Ave
- 8 Otis St
- Lot 4 Brimfield Rd
- 59 High St
- 83 Comins Pond Rd
- 36 Nelson St
- Lot 8 Southbridge Rd
- LOT 7 Southbridge Rd
- 0 Town Farm Rd
- Lot 5 Brimfield Rd
- Lot 3 Brimfield Rd
- Lot 2 Brimfield Rd
- Lot 1 Brimfield Rd
- 95 Town Farm Rd
- Lot 4 Reed St
- Lot 7 Reed St
- 366 Southbridge Rd
- 352 Reed St
- 77 O'Neil Rd
Your Personal Tour Guide
Ask me questions while you tour the home.