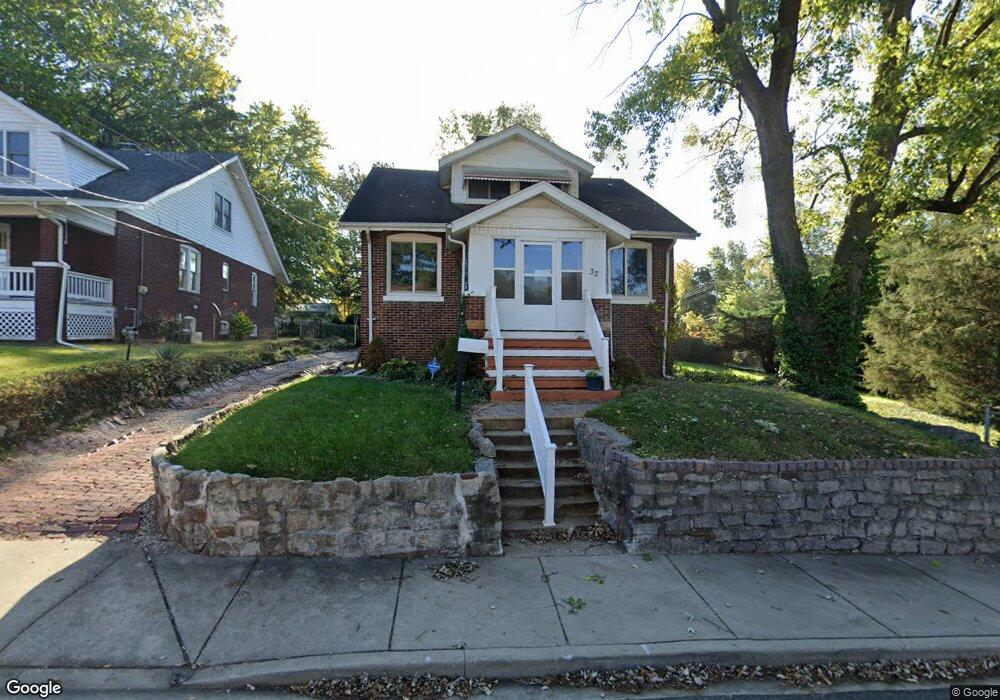
32 S 10th St Belleville, IL 62220
Estimated Value: $94,000 - $142,000
Studio
--
Bath
1,024
Sq Ft
$113/Sq Ft
Est. Value
About This Home
This home is located at 32 S 10th St, Belleville, IL 62220 and is currently estimated at $115,810, approximately $113 per square foot. 32 S 10th St is a home located in St. Clair County with nearby schools including Henry Raab Elementary School, Central Jr High School, and Governor French Academy.
Ownership History
Date
Name
Owned For
Owner Type
Purchase Details
Closed on
Nov 21, 2022
Sold by
Jones Gregory and Jones Audra L
Bought by
Jones Gregory
Current Estimated Value
Home Financials for this Owner
Home Financials are based on the most recent Mortgage that was taken out on this home.
Original Mortgage
$107,572
Interest Rate
6.63%
Mortgage Type
New Conventional
Purchase Details
Closed on
Aug 11, 2004
Sold by
Jones Audra L and Jones Gregory
Bought by
Jones Gregory and Jones Audra L
Purchase Details
Closed on
Aug 1, 1995
Bought by
Jones Gregory and Jones Audra
Create a Home Valuation Report for This Property
The Home Valuation Report is an in-depth analysis detailing your home's value as well as a comparison with similar homes in the area
Home Values in the Area
Average Home Value in this Area
Purchase History
| Date | Buyer | Sale Price | Title Company |
|---|---|---|---|
| Jones Gregory | $56,500 | None Available | |
| Jones Gregory | -- | Multiple | |
| Jones Gregory | $48,000 | -- |
Source: Public Records
Mortgage History
| Date | Status | Borrower | Loan Amount |
|---|---|---|---|
| Previous Owner | Jones Gregory | $107,572 |
Source: Public Records
Tax History
| Year | Tax Paid | Tax Assessment Tax Assessment Total Assessment is a certain percentage of the fair market value that is determined by local assessors to be the total taxable value of land and additions on the property. | Land | Improvement |
|---|---|---|---|---|
| 2024 | $2,700 | $36,705 | $3,847 | $32,858 |
| 2023 | $2,490 | $32,524 | $3,771 | $28,753 |
| 2022 | $2,228 | $29,280 | $3,395 | $25,885 |
| 2021 | $2,101 | $27,069 | $3,139 | $23,930 |
| 2020 | $2,016 | $25,598 | $2,968 | $22,630 |
| 2019 | $2,068 | $25,959 | $2,972 | $22,987 |
| 2018 | $2,008 | $25,398 | $2,908 | $22,490 |
| 2017 | $1,994 | $25,219 | $2,887 | $22,332 |
| 2016 | $1,963 | $24,684 | $2,826 | $21,858 |
| 2014 | $2,037 | $28,033 | $3,824 | $24,209 |
| 2013 | $2,066 | $28,434 | $3,879 | $24,555 |
Source: Public Records
Map
Nearby Homes