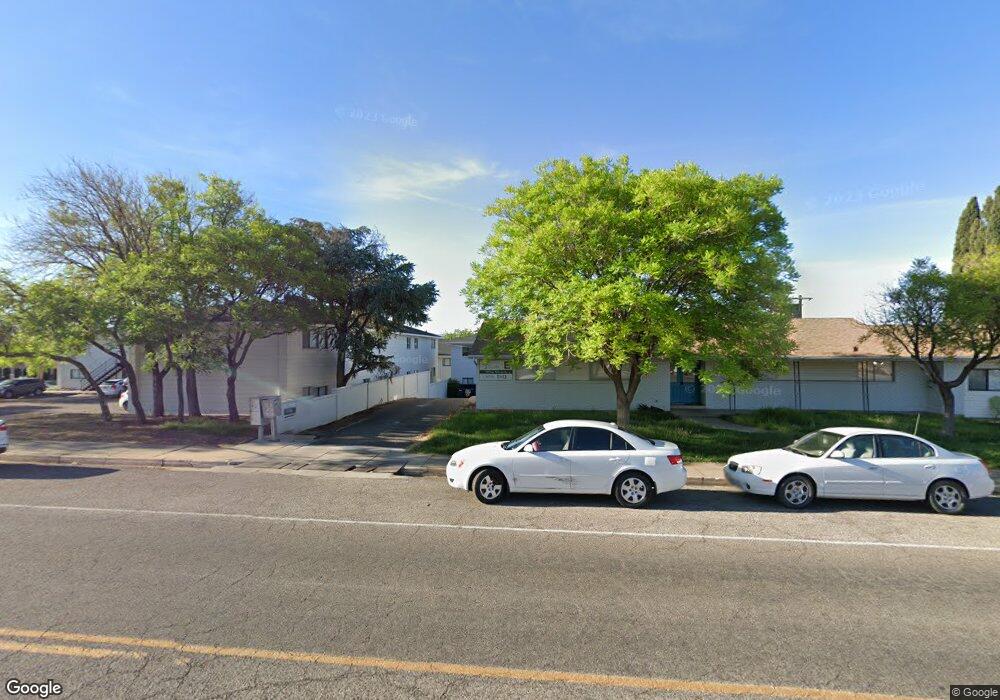
32 S 800 E Saint George, UT 84770
Estimated Value: $2,317,668 - $3,534,000
47
Beds
29
Baths
19,536
Sq Ft
$150/Sq Ft
Est. Value
About This Home
This home is located at 32 S 800 E, Saint George, UT 84770 and is currently estimated at $2,925,834, approximately $149 per square foot. 32 S 800 E is a home located in Washington County with nearby schools including Legacy School, Dixie Middle School, and Tonaquint Intermediate School.
Ownership History
Date
Name
Owned For
Owner Type
Purchase Details
Closed on
Jun 24, 2022
Sold by
Coliseum Apartments Llc
Bought by
Coliseum Apartments Llc
Current Estimated Value
Purchase Details
Closed on
May 21, 2020
Sold by
Coliseum Apartments Llc
Bought by
Coliseum Apartments Llc
Purchase Details
Closed on
Nov 4, 2014
Sold by
Life Is Good Group Llc
Bought by
Coliseum Apartments Llc
Home Financials for this Owner
Home Financials are based on the most recent Mortgage that was taken out on this home.
Original Mortgage
$2,275,000
Interest Rate
4.2%
Mortgage Type
Commercial
Purchase Details
Closed on
Aug 28, 2014
Sold by
Raintree Llc
Bought by
Life Is Good Group Llc and Dk Gardner Llc
Create a Home Valuation Report for This Property
The Home Valuation Report is an in-depth analysis detailing your home's value as well as a comparison with similar homes in the area
Purchase History
| Date | Buyer | Sale Price | Title Company |
|---|---|---|---|
| Coliseum Apartments Llc | -- | None Listed On Document | |
| Coliseum Apartments Llc | -- | None Available | |
| Coliseum Apartments Llc | -- | Southern Utah Title | |
| Life Is Good Group Llc | -- | None Available |
Source: Public Records
Mortgage History
| Date | Status | Borrower | Loan Amount |
|---|---|---|---|
| Previous Owner | Coliseum Apartments Llc | $2,275,000 |
Source: Public Records
Tax History
| Year | Tax Paid | Tax Assessment Tax Assessment Total Assessment is a certain percentage of the fair market value that is determined by local assessors to be the total taxable value of land and additions on the property. | Land | Improvement |
|---|---|---|---|---|
| 2025 | $11,207 | $1,691,855 | $383,295 | $1,308,560 |
| 2023 | $11,221 | $1,676,510 | $365,035 | $1,311,475 |
| 2022 | $10,847 | $1,524,105 | $304,205 | $1,219,900 |
| 2021 | $11,341 | $2,376,400 | $427,600 | $1,948,800 |
| 2020 | $10,878 | $2,146,700 | $427,600 | $1,719,100 |
| 2019 | $10,888 | $2,099,000 | $279,500 | $1,819,500 |
| 2018 | $11,592 | $1,120,350 | $0 | $0 |
| 2017 | $10,827 | $1,046,430 | $0 | $0 |
| 2016 | $7,885 | $671,550 | $0 | $0 |
| 2015 | $7,831 | $671,550 | $0 | $0 |
| 2014 | $7,816 | $674,465 | $0 | $0 |
Source: Public Records
Map
Nearby Homes
- 197 S 600 E
- 339 S 600 E
- 233 S 1000 E
- 380 S 500 E
- 1109 E 400 S
- 459 S 500 E
- 376 E 300 S Unit 2
- 255 S 200 E Unit 13
- 1050 E 500 S Unit 15
- 455 S 1100 E Unit 43
- 96 S 200 E
- 525 S 1100 E Unit 22
- 295 S 200 E
- 245 Red Cliffs Dr Unit 209
- 245 Red Cliffs Dr Unit 113
- 1063 E 600 S Unit 10
- 301 S 1200 E Unit 47
- 301 S 1200 E Unit 16
- 301 S 1200 E Unit 52
- 665 S 500 E
Your Personal Tour Guide
Ask me questions while you tour the home.