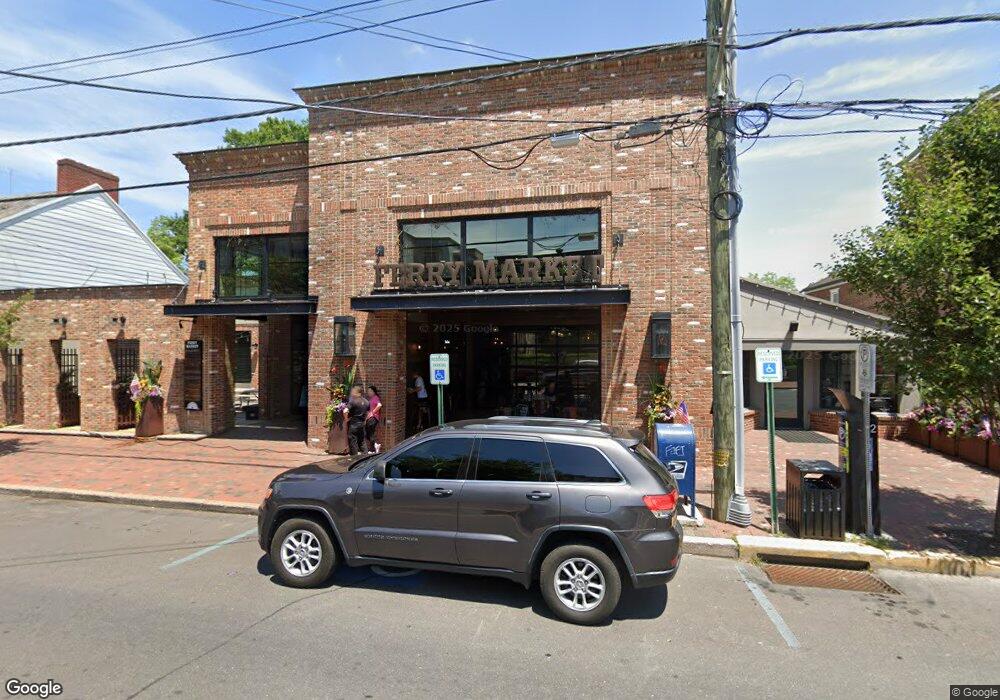
32 S Main St New Hope, PA 18938
Estimated Value: $3,621,877
--
Bed
--
Bath
1,807
Sq Ft
$2,004/Sq Ft
Est. Value
About This Home
This home is located at 32 S Main St, New Hope, PA 18938 and is currently estimated at $3,621,877, approximately $2,004 per square foot. 32 S Main St is a home located in Bucks County with nearby schools including New Hope-Solebury Upper Elementary School, New Hope-Solebury Lower Elementary School, and New Hope-Solebury Middle School.
Ownership History
Date
Name
Owned For
Owner Type
Purchase Details
Closed on
Dec 14, 2024
Sold by
Playhouse Inn Property Llc
Bought by
Ferry Market Llc
Current Estimated Value
Purchase Details
Closed on
Dec 31, 2014
Sold by
Four Seasons Mall Fee Lp
Bought by
Plyhouse Inn Property Llc
Purchase Details
Closed on
Sep 4, 2008
Sold by
Sandor Herbert
Bought by
Four Seasons Mall Fee Lp
Home Financials for this Owner
Home Financials are based on the most recent Mortgage that was taken out on this home.
Original Mortgage
$2,560,000
Interest Rate
6.57%
Mortgage Type
Future Advance Clause Open End Mortgage
Purchase Details
Closed on
Feb 24, 1997
Sold by
Sandor Herbert and Sandor Richard
Bought by
Sandor Herbert
Purchase Details
Closed on
Oct 11, 1996
Sold by
Sandor Richard and Sandor Alyce
Bought by
Sandor Richard
Purchase Details
Closed on
Jul 15, 1996
Sold by
Netherlands Associates
Bought by
Sandor Herbert and Sandor Richard
Create a Home Valuation Report for This Property
The Home Valuation Report is an in-depth analysis detailing your home's value as well as a comparison with similar homes in the area
Home Values in the Area
Average Home Value in this Area
Purchase History
| Date | Buyer | Sale Price | Title Company |
|---|---|---|---|
| Ferry Market Llc | -- | None Listed On Document | |
| Ferry Market Llc | -- | None Listed On Document | |
| Plyhouse Inn Property Llc | $2,000,000 | None Available | |
| Four Seasons Mall Fee Lp | $3,200,000 | None Available | |
| Sandor Herbert | -- | -- | |
| Sandor Richard | -- | -- | |
| Sandor Herbert | -- | -- |
Source: Public Records
Mortgage History
| Date | Status | Borrower | Loan Amount |
|---|---|---|---|
| Previous Owner | Four Seasons Mall Fee Lp | $2,560,000 |
Source: Public Records
Tax History Compared to Growth
Tax History
| Year | Tax Paid | Tax Assessment Tax Assessment Total Assessment is a certain percentage of the fair market value that is determined by local assessors to be the total taxable value of land and additions on the property. | Land | Improvement |
|---|---|---|---|---|
| 2025 | $45,067 | $295,250 | $69,000 | $226,250 |
| 2024 | $45,067 | $295,250 | $69,000 | $226,250 |
| 2023 | $43,831 | $295,250 | $69,000 | $226,250 |
| 2022 | $43,512 | $295,250 | $69,000 | $226,250 |
| 2021 | $42,582 | $295,250 | $69,000 | $226,250 |
| 2020 | $41,796 | $295,250 | $69,000 | $226,250 |
| 2019 | $40,822 | $295,250 | $69,000 | $226,250 |
| 2018 | $40,129 | $295,250 | $69,000 | $226,250 |
| 2017 | $34,319 | $262,160 | $69,000 | $193,160 |
| 2016 | $34,319 | $262,160 | $69,000 | $193,160 |
| 2015 | -- | $297,290 | $69,000 | $228,290 |
| 2014 | -- | $297,290 | $69,000 | $228,290 |
Source: Public Records
Map
Nearby Homes
- 38 W Ferry St
- 64 N Main St
- 100 W Bridge St
- 14 Lambert Ln
- 16 Lambert Ln
- 27 Arden Way
- 130 N Main St Unit C
- 130 N Main St Unit B
- 23 Swan St
- 17 Wilson St Unit 2
- 17 Wilson St Unit 1
- 17 Wilson St Unit 2
- 17 Wilson St Unit 1
- 2 Runnemede
- 38 Swan St
- 53 Ferry St
- 218 Towpath St
- 4 Aspen
- 61 S Main St
- 79 Wilson St
- 32 S Main St Unit 14
- 32 S Main St Unit 11
- 32 S Main St Unit 8
- 32 S Main St Unit 4
- 32 S Main St Unit 13
- 32 S Main St Unit 5
- 28 S Main St
- 28 S Main St Unit SOUTH
- 36 S Main St Unit 1ST FL
- 36 S Main St Unit SECOND FLOOR FRONT
- 36 S Main St Unit REAR
- 36 S Main St Unit 3RD FL
- 36 S Main St Unit 2 R
- 36 S Main St
- 40 S Main St
- 16 S Main St
- 22 S Main St
- 20 S Main St
- 26 S Main St
- 26 S Main St