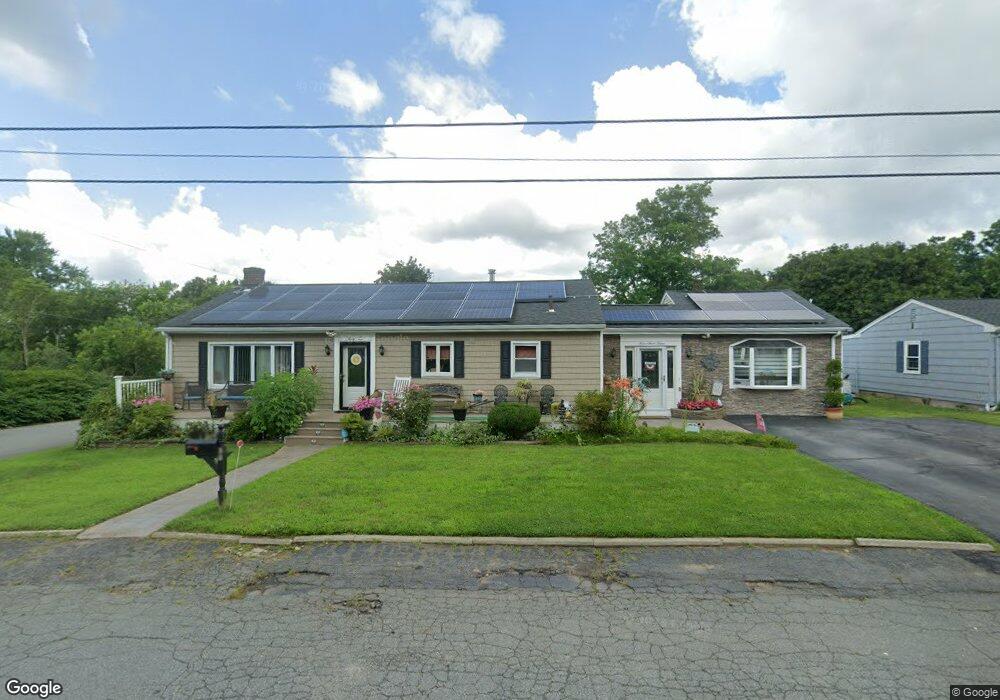
32 Saucier St Acushnet, MA 02743
Estimated Value: $455,045 - $520,000
3
Beds
1
Bath
1,863
Sq Ft
$260/Sq Ft
Est. Value
About This Home
This home is located at 32 Saucier St, Acushnet, MA 02743 and is currently estimated at $483,511, approximately $259 per square foot. 32 Saucier St is a home located in Bristol County with nearby schools including Acushnet Elementary School, Albert F Ford Middle School, and Alma Del Mar Charter School.
Ownership History
Date
Name
Owned For
Owner Type
Purchase Details
Closed on
Jun 1, 1998
Sold by
Sol Michael A and Correia Steven
Bought by
Ferreira Robert C and Ferreira Stefanie
Current Estimated Value
Purchase Details
Closed on
Mar 25, 1991
Sold by
Robillard Rita
Bought by
Sol Michael A
Create a Home Valuation Report for This Property
The Home Valuation Report is an in-depth analysis detailing your home's value as well as a comparison with similar homes in the area
Home Values in the Area
Average Home Value in this Area
Purchase History
| Date | Buyer | Sale Price | Title Company |
|---|---|---|---|
| Ferreira Robert C | $116,000 | -- | |
| Sol Michael A | $126,000 | -- |
Source: Public Records
Mortgage History
| Date | Status | Borrower | Loan Amount |
|---|---|---|---|
| Open | Sol Michael A | $108,000 | |
| Closed | Sol Michael A | $70,000 | |
| Open | Sol Michael A | $163,500 |
Source: Public Records
Tax History
| Year | Tax Paid | Tax Assessment Tax Assessment Total Assessment is a certain percentage of the fair market value that is determined by local assessors to be the total taxable value of land and additions on the property. | Land | Improvement |
|---|---|---|---|---|
| 2025 | $40 | $373,600 | $92,400 | $281,200 |
| 2024 | $3,844 | $336,900 | $88,100 | $248,800 |
| 2023 | $3,689 | $307,400 | $79,500 | $227,900 |
| 2022 | $3,645 | $274,700 | $75,200 | $199,500 |
| 2021 | $3,491 | $252,400 | $75,200 | $177,200 |
| 2020 | $3,518 | $252,400 | $75,200 | $177,200 |
| 2019 | $3,300 | $232,700 | $66,600 | $166,100 |
| 2018 | $3,162 | $219,300 | $66,600 | $152,700 |
| 2017 | $3,051 | $211,300 | $66,600 | $144,700 |
| 2016 | $2,966 | $204,100 | $66,600 | $137,500 |
| 2015 | $2,795 | $195,700 | $66,600 | $129,100 |
Source: Public Records
Map
Nearby Homes
Your Personal Tour Guide
Ask me questions while you tour the home.