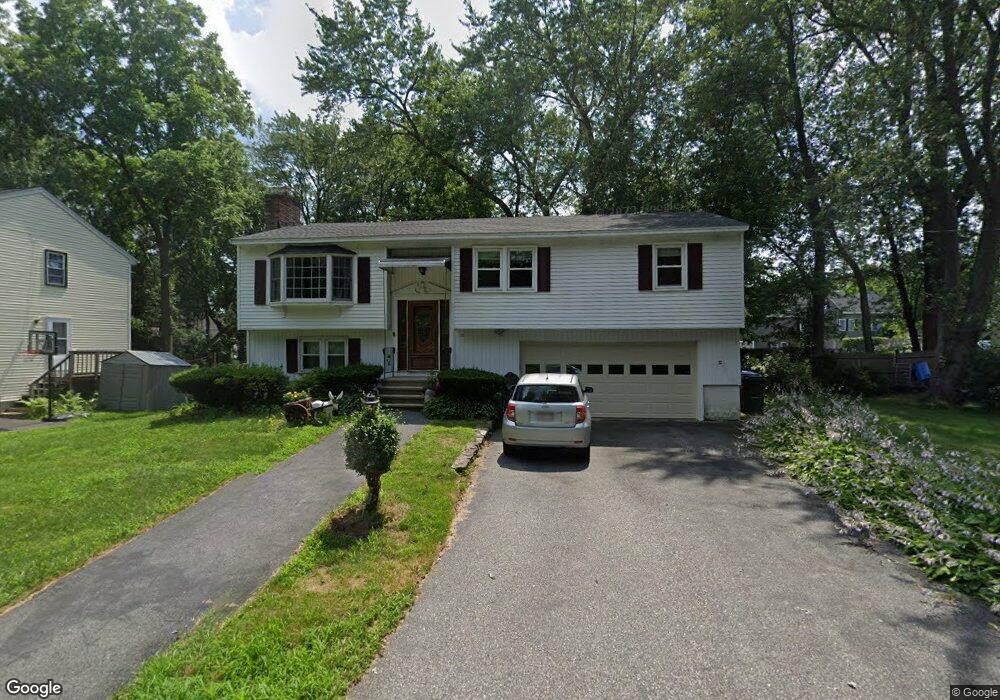
32 Schley St Methuen, MA 01844
The East End NeighborhoodEstimated Value: $598,000 - $685,000
3
Beds
2
Baths
1,470
Sq Ft
$429/Sq Ft
Est. Value
About This Home
This home is located at 32 Schley St, Methuen, MA 01844 and is currently estimated at $631,059, approximately $429 per square foot. 32 Schley St is a home located in Essex County with nearby schools including Timony Grammar School, Methuen High School, and Community Day Charter Public School - Gateway.
Ownership History
Date
Name
Owned For
Owner Type
Purchase Details
Closed on
Jul 11, 2012
Sold by
Lam Tom and Ky Yen T
Bought by
Lam Lynn and Lam Michael V
Current Estimated Value
Purchase Details
Closed on
Jan 19, 1995
Sold by
Brickyard Rt
Bought by
Morse Richard C
Home Financials for this Owner
Home Financials are based on the most recent Mortgage that was taken out on this home.
Original Mortgage
$105,450
Interest Rate
9.16%
Mortgage Type
Purchase Money Mortgage
Purchase Details
Closed on
Jan 7, 1994
Sold by
Kuzmitski Kenneth
Bought by
Brickyard Rt
Home Financials for this Owner
Home Financials are based on the most recent Mortgage that was taken out on this home.
Original Mortgage
$40,000
Interest Rate
7.23%
Mortgage Type
Purchase Money Mortgage
Purchase Details
Closed on
Oct 8, 1993
Sold by
Kuzmitski Kenneth P
Bought by
Lam Tom
Create a Home Valuation Report for This Property
The Home Valuation Report is an in-depth analysis detailing your home's value as well as a comparison with similar homes in the area
Home Values in the Area
Average Home Value in this Area
Purchase History
| Date | Buyer | Sale Price | Title Company |
|---|---|---|---|
| Lam Lynn | -- | -- | |
| Morse Richard C | $111,000 | -- | |
| Brickyard Rt | $17,000 | -- | |
| Lam Tom | $118,000 | -- |
Source: Public Records
Mortgage History
| Date | Status | Borrower | Loan Amount |
|---|---|---|---|
| Previous Owner | Lam Tom | $161,500 | |
| Previous Owner | Lam Tom | $105,450 | |
| Previous Owner | Lam Tom | $40,000 |
Source: Public Records
Tax History
| Year | Tax Paid | Tax Assessment Tax Assessment Total Assessment is a certain percentage of the fair market value that is determined by local assessors to be the total taxable value of land and additions on the property. | Land | Improvement |
|---|---|---|---|---|
| 2025 | $5,373 | $507,800 | $211,000 | $296,800 |
| 2024 | $5,453 | $502,100 | $192,500 | $309,600 |
| 2023 | $5,139 | $439,200 | $171,100 | $268,100 |
| 2022 | $4,857 | $372,200 | $135,400 | $236,800 |
| 2021 | $4,610 | $349,500 | $128,300 | $221,200 |
| 2020 | $4,571 | $340,100 | $128,300 | $211,800 |
| 2019 | $4,507 | $317,600 | $121,200 | $196,400 |
| 2018 | $4,245 | $297,500 | $114,000 | $183,500 |
| 2017 | $4,071 | $277,900 | $114,000 | $163,900 |
| 2016 | $3,809 | $257,200 | $99,800 | $157,400 |
| 2015 | $3,707 | $253,900 | $99,800 | $154,100 |
Source: Public Records
Map
Nearby Homes
- 1 Riverview Blvd Unit 3-8
- 270 E Haverhill St Unit 12
- 3 Thissell St
- 106 Leroy Ave
- 21 Oak St Unit A
- 5 Weisner Pkwy
- 80 Ferry St Unit 80A
- 144 Ferry St
- 35 Swan Ave
- 68 Ashford St
- 24 Court St
- 24 Boylston St
- 160 1/2 East St
- 63 Lippold St
- 19-21 Pleasant Terrace
- 52 Howard St
- 7 Stevens Ct
- 192 Union St
- 86 Comet Rd
- 37 Albion St