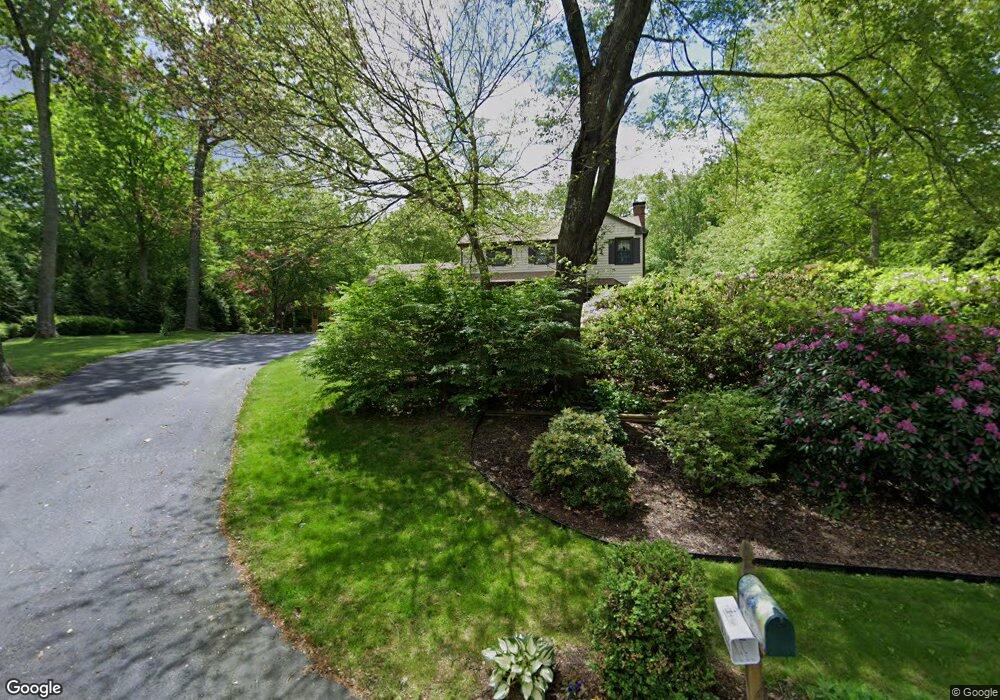
32 Seabury Ave Ledyard, CT 06339
Estimated Value: $469,000 - $532,000
4
Beds
3
Baths
2,174
Sq Ft
$229/Sq Ft
Est. Value
About This Home
This home is located at 32 Seabury Ave, Ledyard, CT 06339 and is currently estimated at $497,716, approximately $228 per square foot. 32 Seabury Ave is a home located in New London County with nearby schools including Ledyard Middle School and Ledyard High School.
Ownership History
Date
Name
Owned For
Owner Type
Purchase Details
Closed on
Nov 18, 2015
Sold by
Blanchet Jean Est
Bought by
Vargas Esteban
Current Estimated Value
Home Financials for this Owner
Home Financials are based on the most recent Mortgage that was taken out on this home.
Original Mortgage
$288,573
Outstanding Balance
$226,977
Interest Rate
3.79%
Mortgage Type
VA
Estimated Equity
$270,739
Purchase Details
Closed on
Jun 10, 2010
Sold by
Patel Amit V and Patel Vitthalbhai
Bought by
Tate Daniel T and Brousseau Stephanie E
Home Financials for this Owner
Home Financials are based on the most recent Mortgage that was taken out on this home.
Original Mortgage
$137,600
Interest Rate
5.11%
Purchase Details
Closed on
Dec 29, 2009
Sold by
Hakkinen Virginia M
Bought by
Hakkinen Virginia M and Hakkinen William J
Purchase Details
Closed on
Jun 28, 2006
Sold by
Fleming Joellen
Bought by
Patel Amit and Patel Vitthalbhai
Home Financials for this Owner
Home Financials are based on the most recent Mortgage that was taken out on this home.
Original Mortgage
$196,000
Interest Rate
6.58%
Create a Home Valuation Report for This Property
The Home Valuation Report is an in-depth analysis detailing your home's value as well as a comparison with similar homes in the area
Home Values in the Area
Average Home Value in this Area
Purchase History
| Date | Buyer | Sale Price | Title Company |
|---|---|---|---|
| Vargas Esteban | $282,500 | -- | |
| Tate Daniel T | $140,220 | -- | |
| Hakkinen Virginia M | -- | -- | |
| Patel Amit | $245,000 | -- |
Source: Public Records
Mortgage History
| Date | Status | Borrower | Loan Amount |
|---|---|---|---|
| Open | Vargas Esteban | $288,573 | |
| Previous Owner | Patel Amit | $137,600 | |
| Previous Owner | Patel Amit | $196,000 |
Source: Public Records
Tax History
| Year | Tax Paid | Tax Assessment Tax Assessment Total Assessment is a certain percentage of the fair market value that is determined by local assessors to be the total taxable value of land and additions on the property. | Land | Improvement |
|---|---|---|---|---|
| 2025 | $8,007 | $215,600 | $57,330 | $158,270 |
| 2024 | $7,567 | $214,900 | $57,330 | $157,570 |
| 2023 | $7,427 | $214,900 | $57,330 | $157,570 |
| 2022 | $7,268 | $214,900 | $57,330 | $157,570 |
| 2021 | $7,221 | $214,900 | $57,330 | $157,570 |
| 2020 | $6,981 | $199,640 | $64,820 | $134,820 |
| 2019 | $6,999 | $199,640 | $64,820 | $134,820 |
| 2018 | $6,846 | $199,640 | $64,820 | $134,820 |
| 2017 | $6,496 | $199,640 | $64,820 | $134,820 |
| 2016 | $6,369 | $199,640 | $64,820 | $134,820 |
| 2015 | $6,069 | $199,640 | $64,820 | $134,820 |
| 2014 | $6,179 | $206,640 | $64,820 | $141,820 |
Source: Public Records
Map
Nearby Homes
- 25 Coachman Pike
- 3 Hilltop Dr
- 24 Fairway Dr Unit 9
- 16 Abbey Rd
- 14 Abbey Rd
- 669 Colonel Ledyard Hwy
- 991 Shewville Rd
- 20 Lakeside Dr Unit K
- 14 Pennywise Ln
- 115 Meeting House Ln
- 16 Marlene Dr
- 381 Route 2
- 23 Avery Hill Rd
- 48 Bittersweet Dr
- 497 Colonel Ledyard Hwy
- 256 Route 2
- 22 Boulder Way
- 11 Willow Ln
- 575 Shewville Rd
- 104 Route 2a
Your Personal Tour Guide
Ask me questions while you tour the home.