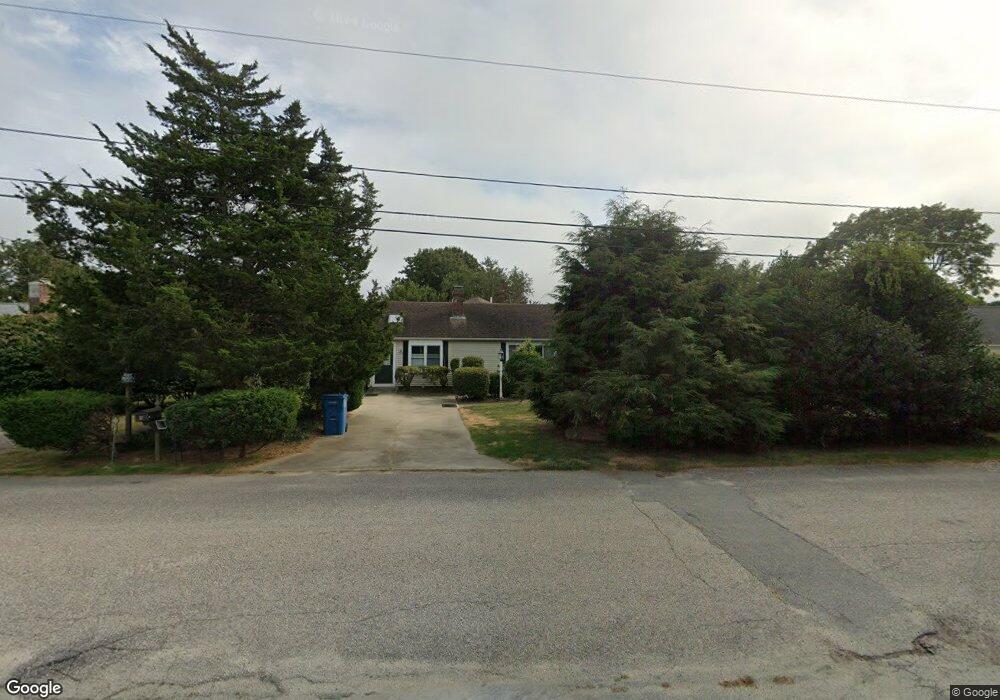
32 Sharon Ann Ln East Falmouth, MA 02536
Estimated Value: $392,300
2
Beds
1
Bath
1,001
Sq Ft
$392/Sq Ft
Est. Value
About This Home
This home is located at 32 Sharon Ann Ln, East Falmouth, MA 02536 and is currently estimated at $392,300, approximately $391 per square foot. 32 Sharon Ann Ln is a home located in Barnstable County with nearby schools including East Falmouth Elementary School, Morse Pond School, and Lawrence School.
Ownership History
Date
Name
Owned For
Owner Type
Purchase Details
Closed on
Nov 4, 1994
Sold by
Scaltsas Genevieve and Scaltsas Theodore Athena
Bought by
Grier John F and Grier Betty M
Current Estimated Value
Home Financials for this Owner
Home Financials are based on the most recent Mortgage that was taken out on this home.
Original Mortgage
$76,800
Interest Rate
8.71%
Mortgage Type
Commercial
Create a Home Valuation Report for This Property
The Home Valuation Report is an in-depth analysis detailing your home's value as well as a comparison with similar homes in the area
Home Values in the Area
Average Home Value in this Area
Purchase History
| Date | Buyer | Sale Price | Title Company |
|---|---|---|---|
| Grier John F | $96,000 | -- | |
| Grier John F | $96,000 | -- |
Source: Public Records
Mortgage History
| Date | Status | Borrower | Loan Amount |
|---|---|---|---|
| Open | Grier John F | $81,000 | |
| Closed | Grier John F | $7,500 | |
| Closed | Grier John F | $76,800 |
Source: Public Records
Tax History Compared to Growth
Tax History
| Year | Tax Paid | Tax Assessment Tax Assessment Total Assessment is a certain percentage of the fair market value that is determined by local assessors to be the total taxable value of land and additions on the property. | Land | Improvement |
|---|---|---|---|---|
| 2025 | $3,587 | $611,100 | $255,700 | $355,400 |
| 2024 | $3,120 | $496,800 | $228,300 | $268,500 |
| 2023 | $2,846 | $411,300 | $182,700 | $228,600 |
| 2022 | $2,943 | $365,600 | $158,600 | $207,000 |
| 2021 | $2,839 | $334,000 | $151,700 | $182,300 |
| 2020 | $2,751 | $320,200 | $137,900 | $182,300 |
| 2019 | $2,642 | $308,700 | $137,900 | $170,800 |
| 2018 | $2,591 | $301,300 | $137,900 | $163,400 |
| 2017 | $2,526 | $296,100 | $137,900 | $158,200 |
| 2016 | $2,478 | $296,100 | $137,900 | $158,200 |
| 2015 | $2,425 | $296,100 | $137,900 | $158,200 |
| 2014 | $2,440 | $299,400 | $142,300 | $157,100 |
Source: Public Records
Map
Nearby Homes
- 38 Sharon Ann Ln
- 26 Sharon Ann Ln
- 29 Captains Ln
- 37 Captains Ln
- 29 Sharon Ann Ln
- 37 Sharon Ann Ln
- 40 Sharon Ann Ln
- 20 Sharon Ann Ln
- 23 Captains Ln
- 34 Captains Ln
- 28 Captains Ln
- 23 Sharon Ann Ln
- 47 Captains Ln
- 22 Captains Ln
- 50 Sharon Ann Ln
- 3 Vintro Ct
- 19 Sharon Ann Ln
- 16 Sharon Ann Ln
- 25 Seatucket Rd
- 46 Captains Ln