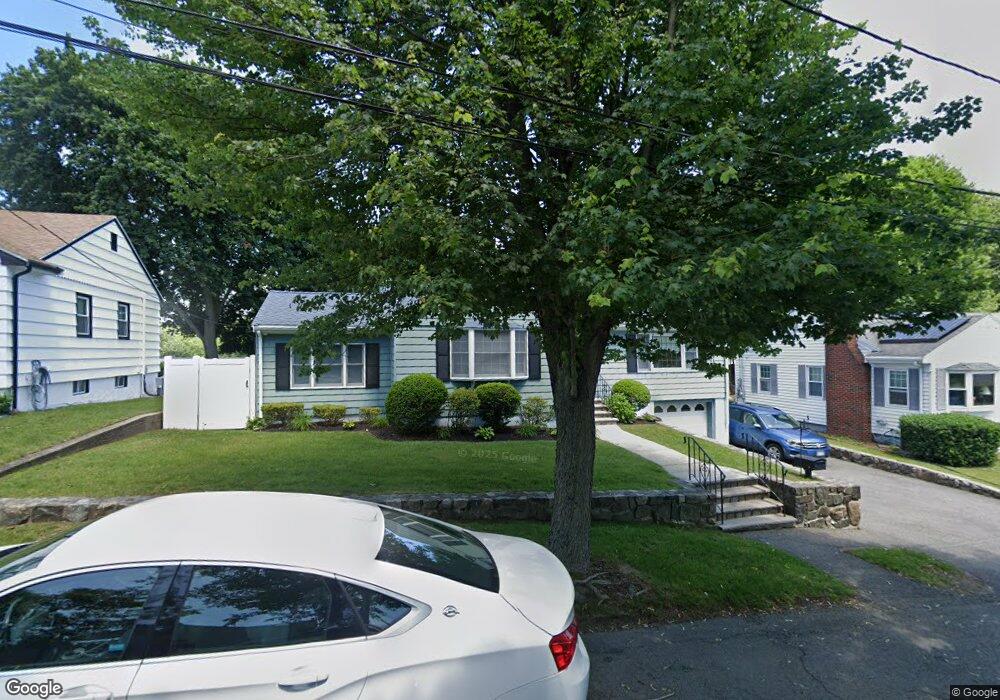
32 Sheehan Rd Lynn, MA 01904
Fays Estate NeighborhoodEstimated Value: $623,610 - $715,000
2
Beds
2
Baths
1,358
Sq Ft
$490/Sq Ft
Est. Value
About This Home
This home is located at 32 Sheehan Rd, Lynn, MA 01904 and is currently estimated at $664,903, approximately $489 per square foot. 32 Sheehan Rd is a home located in Essex County with nearby schools including Edward A. Sisson Elementary School, William R. Fallon School, and Pickering Middle School.
Ownership History
Date
Name
Owned For
Owner Type
Purchase Details
Closed on
Jun 1, 2018
Sold by
Cusack John J
Bought by
Oconnor Mary I
Current Estimated Value
Purchase Details
Closed on
Mar 16, 2015
Sold by
Cusack John J and Cusack Anne M
Bought by
Cusack John J
Purchase Details
Closed on
Jun 29, 1987
Sold by
Mears Walter G
Bought by
Cusack John
Home Financials for this Owner
Home Financials are based on the most recent Mortgage that was taken out on this home.
Original Mortgage
$98,000
Interest Rate
10.5%
Mortgage Type
Purchase Money Mortgage
Create a Home Valuation Report for This Property
The Home Valuation Report is an in-depth analysis detailing your home's value as well as a comparison with similar homes in the area
Home Values in the Area
Average Home Value in this Area
Purchase History
| Date | Buyer | Sale Price | Title Company |
|---|---|---|---|
| Oconnor Mary I | -- | -- | |
| Cusack John J | -- | -- | |
| Cusack John | $178,000 | -- |
Source: Public Records
Mortgage History
| Date | Status | Borrower | Loan Amount |
|---|---|---|---|
| Previous Owner | Cusack John | $10,000 | |
| Previous Owner | Cusack John | $3,000 | |
| Previous Owner | Cusack John | $98,000 |
Source: Public Records
Tax History
| Year | Tax Paid | Tax Assessment Tax Assessment Total Assessment is a certain percentage of the fair market value that is determined by local assessors to be the total taxable value of land and additions on the property. | Land | Improvement |
|---|---|---|---|---|
| 2025 | $5,924 | $571,800 | $210,900 | $360,900 |
| 2024 | $5,598 | $531,600 | $204,900 | $326,700 |
| 2023 | $5,475 | $491,000 | $201,200 | $289,800 |
| 2022 | $5,336 | $429,300 | $183,600 | $245,700 |
| 2021 | $5,002 | $383,900 | $159,600 | $224,300 |
| 2020 | $4,906 | $366,100 | $148,900 | $217,200 |
| 2019 | $4,879 | $341,200 | $141,100 | $200,100 |
| 2018 | $4,842 | $319,600 | $145,200 | $174,400 |
| 2017 | $4,501 | $288,500 | $123,000 | $165,500 |
| 2016 | $4,228 | $261,300 | $110,500 | $150,800 |
| 2015 | $4,082 | $243,700 | $110,500 | $133,200 |
Source: Public Records
Map
Nearby Homes
- 31 Atkins Ave
- 38 Ledgemont Ln
- 73 Lockwood Rd
- 39 Kelly Ln
- 11 Urban St
- 19 Gage St
- 100 Magnolia Ave Unit 5
- 17 Lummus Ct
- 27-29 Graves Ave
- 354 Broadway Unit 3
- 431-433 Chatham St
- 10 Pond St
- 2 Chestnut Terrace
- 6A Goodridge St
- 10 Fairview Rd
- 18 Kittredge St
- 1 Clough St
- 91 Oakwood Ave
- 52 Savory St
- 5 Floyd Ave
Your Personal Tour Guide
Ask me questions while you tour the home.