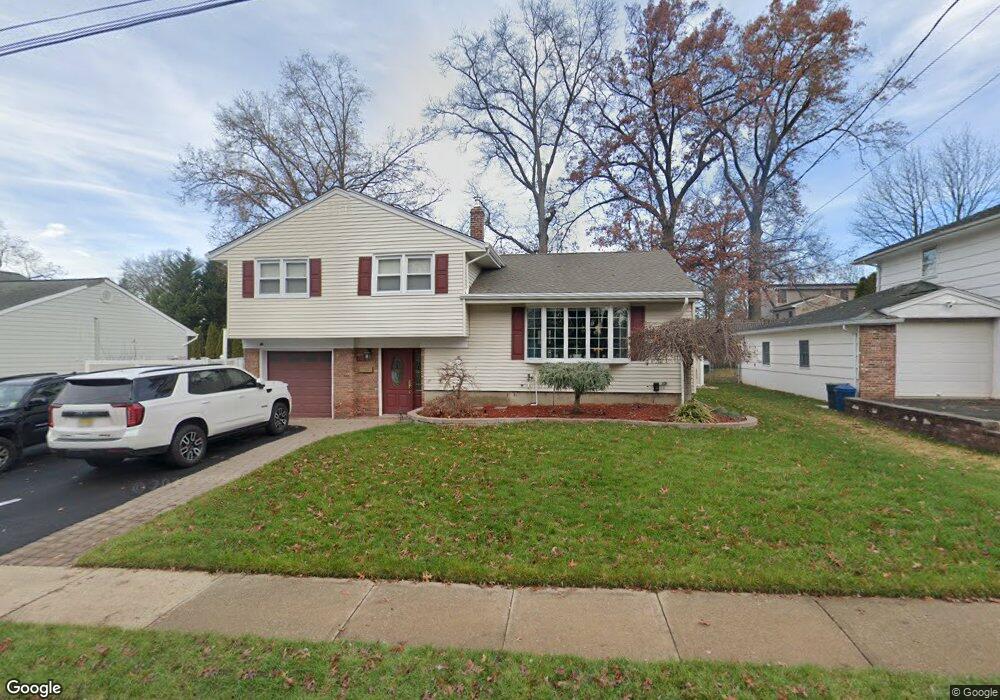
32 Spring Dr Dumont, NJ 07628
Estimated Value: $652,000 - $703,000
Studio
--
Bath
1,681
Sq Ft
$402/Sq Ft
Est. Value
About This Home
This home is located at 32 Spring Dr, Dumont, NJ 07628 and is currently estimated at $676,532, approximately $402 per square foot. 32 Spring Dr is a home located in Bergen County with nearby schools including Dumont High School, Solomon Schechter Day School, and Top Stone Montesorri.
Ownership History
Date
Name
Owned For
Owner Type
Purchase Details
Closed on
Jun 4, 2013
Sold by
Holtje Bruce R and Holtje Regina L
Bought by
Colon Edwin and Colon Lindy
Current Estimated Value
Home Financials for this Owner
Home Financials are based on the most recent Mortgage that was taken out on this home.
Original Mortgage
$430,046
Outstanding Balance
$303,279
Interest Rate
3.45%
Mortgage Type
FHA
Estimated Equity
$373,253
Create a Home Valuation Report for This Property
The Home Valuation Report is an in-depth analysis detailing your home's value as well as a comparison with similar homes in the area
Home Values in the Area
Average Home Value in this Area
Purchase History
| Date | Buyer | Sale Price | Title Company |
|---|---|---|---|
| Colon Edwin | $438,000 | -- |
Source: Public Records
Mortgage History
| Date | Status | Borrower | Loan Amount |
|---|---|---|---|
| Open | Colon Edwin | $430,046 |
Source: Public Records
Tax History
| Year | Tax Paid | Tax Assessment Tax Assessment Total Assessment is a certain percentage of the fair market value that is determined by local assessors to be the total taxable value of land and additions on the property. | Land | Improvement |
|---|---|---|---|---|
| 2025 | $14,374 | $611,000 | $310,200 | $300,800 |
| 2024 | $14,020 | $353,600 | $175,300 | $178,300 |
| 2023 | $13,730 | $353,600 | $175,300 | $178,300 |
| 2022 | $13,730 | $353,600 | $175,300 | $178,300 |
| 2021 | $13,663 | $353,600 | $175,300 | $178,300 |
| 2020 | $13,292 | $353,600 | $175,300 | $178,300 |
| 2019 | $12,974 | $353,600 | $175,300 | $178,300 |
| 2018 | $12,708 | $353,600 | $175,300 | $178,300 |
| 2017 | $12,464 | $353,600 | $175,300 | $178,300 |
| 2016 | $12,174 | $353,600 | $175,300 | $178,300 |
| 2015 | $11,895 | $353,600 | $175,300 | $178,300 |
| 2014 | $11,662 | $353,600 | $175,300 | $178,300 |
Source: Public Records
Map
Nearby Homes
- 201 Dixon Ave
- 18 Byrne Place
- 158 W Madison Ave
- 113 Woods Ave
- 560 Boulevard
- 4 Banta Place
- 229 Sutton Place
- 57 Johnson Ave
- 719 Cypress St
- 16 Seminole Ave
- 196 Graphic Blvd
- 227 Cedar Rd
- 16 Roosevelt Ave
- 144 New Milford Ave
- 28 Park Ave
- 243 Main St
- 627 Concord St
- 22 W Central Ave
- 95 W Shore Ave
- 33 Harcourt Ave
Your Personal Tour Guide
Ask me questions while you tour the home.