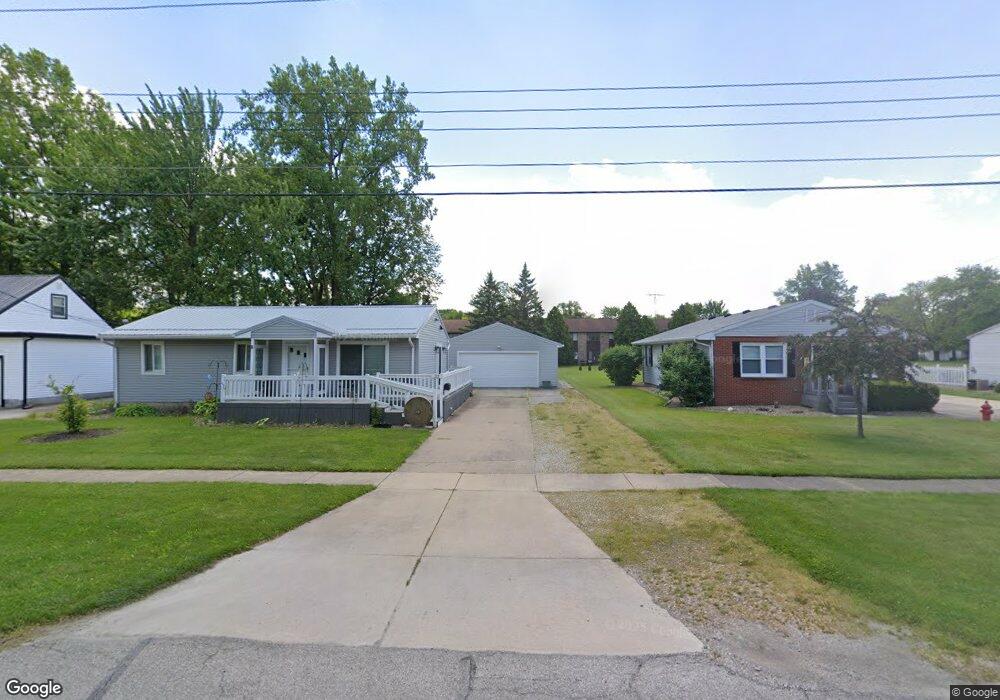
32 Spring St Norwalk, OH 44857
Estimated Value: $135,000 - $182,000
3
Beds
2
Baths
1,040
Sq Ft
$150/Sq Ft
Est. Value
About This Home
This home is located at 32 Spring St, Norwalk, OH 44857 and is currently estimated at $155,914, approximately $149 per square foot. 32 Spring St is a home located in Huron County with nearby schools including Maplehurst Elementary School, League Elementary School, and Pleasant Elementary School.
Ownership History
Date
Name
Owned For
Owner Type
Purchase Details
Closed on
Apr 20, 2021
Sold by
Statzer Jenkins Joyce Ann
Bought by
Statzer Marilyn K
Current Estimated Value
Home Financials for this Owner
Home Financials are based on the most recent Mortgage that was taken out on this home.
Original Mortgage
$54,000
Outstanding Balance
$48,372
Interest Rate
3.05%
Mortgage Type
New Conventional
Estimated Equity
$107,542
Purchase Details
Closed on
Apr 16, 2021
Sold by
Jenkins Rufus D
Bought by
Statzer Jenkins Joyce Ann
Home Financials for this Owner
Home Financials are based on the most recent Mortgage that was taken out on this home.
Original Mortgage
$54,000
Outstanding Balance
$48,372
Interest Rate
3.05%
Mortgage Type
New Conventional
Estimated Equity
$107,542
Purchase Details
Closed on
Aug 3, 2012
Bought by
Joyce Rufus D and Joyce Ann Statzer
Purchase Details
Closed on
May 30, 2003
Bought by
Statzer Joyce A
Purchase Details
Closed on
May 2, 2003
Bought by
Truchon Benjamin L
Purchase Details
Closed on
Nov 6, 1986
Bought by
Truchon Benjamin L
Create a Home Valuation Report for This Property
The Home Valuation Report is an in-depth analysis detailing your home's value as well as a comparison with similar homes in the area
Home Values in the Area
Average Home Value in this Area
Purchase History
| Date | Buyer | Sale Price | Title Company |
|---|---|---|---|
| Statzer Marilyn K | $60,000 | Newman Title | |
| Statzer Jenkins Joyce Ann | -- | Newman Title | |
| Joyce Rufus D | -- | -- | |
| Statzer Joyce A | $89,500 | -- | |
| Truchon Benjamin L | -- | -- | |
| Truchon Benjamin L | $48,000 | -- |
Source: Public Records
Mortgage History
| Date | Status | Borrower | Loan Amount |
|---|---|---|---|
| Open | Statzer Marilyn K | $54,000 |
Source: Public Records
Tax History
| Year | Tax Paid | Tax Assessment Tax Assessment Total Assessment is a certain percentage of the fair market value that is determined by local assessors to be the total taxable value of land and additions on the property. | Land | Improvement |
|---|---|---|---|---|
| 2024 | $1,545 | $37,720 | $7,130 | $30,590 |
| 2023 | $1,539 | $31,400 | $6,250 | $25,150 |
| 2022 | $1,266 | $31,400 | $6,250 | $25,150 |
| 2021 | $1,266 | $31,400 | $6,250 | $25,150 |
| 2020 | $1,075 | $25,360 | $6,250 | $19,110 |
| 2019 | $1,051 | $25,360 | $6,250 | $19,110 |
| 2018 | $1,033 | $25,360 | $6,250 | $19,110 |
| 2017 | $1,002 | $24,510 | $6,250 | $18,260 |
| 2016 | $1,044 | $26,040 | $6,250 | $19,790 |
| 2015 | $1,044 | $26,040 | $6,250 | $19,790 |
| 2014 | $1,173 | $29,020 | $6,760 | $22,260 |
| 2013 | $1,019 | $29,020 | $6,760 | $22,260 |
Source: Public Records
Map
Nearby Homes
- 33 E League St
- 167 Whittlesey Ave
- 118 Milan Ave
- 41 W Willard Ave
- 6 White Tail Way Unit C
- 19 Deer Track Trail
- 33 Falcon Crest Dr Unit C
- 11 Deer Track Trail Unit A
- 3 Fox Run Cove
- 3 Fox Run Cove Unit B
- 0 Milan Ave
- 123 E Main St
- 43 Gallup Ave
- 15 Minard Place
- 65 Grassland Cir
- 73 Parsons St
- 184 Tucker Ave
- 110 Parsons St
- 36 Cortland St
- 11 Oak St
Your Personal Tour Guide
Ask me questions while you tour the home.