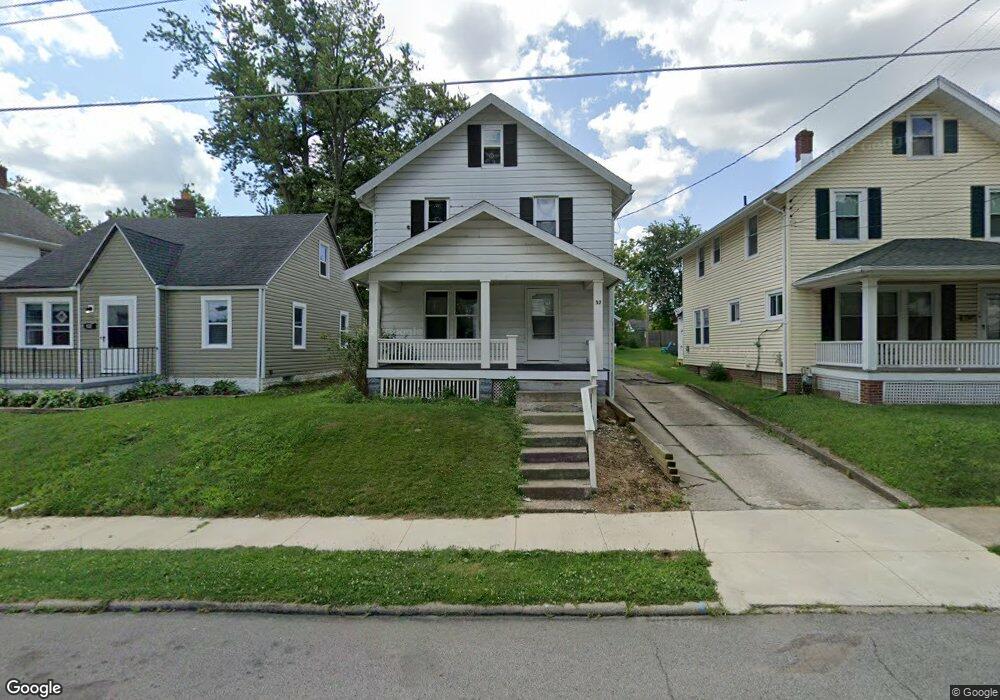
32 State St Mansfield, OH 44907
Estimated Value: $64,000 - $110,000
3
Beds
2
Baths
1,450
Sq Ft
$61/Sq Ft
Est. Value
About This Home
This home is located at 32 State St, Mansfield, OH 44907 and is currently estimated at $87,737, approximately $60 per square foot. 32 State St is a home located in Richland County with nearby schools including The Richland School of Academic Arts and St. Peter's Junior High / High School.
Ownership History
Date
Name
Owned For
Owner Type
Purchase Details
Closed on
Aug 24, 2010
Sold by
Fannie Mae
Bought by
Winegarden Blaine
Current Estimated Value
Purchase Details
Closed on
May 3, 2010
Sold by
Chase Home Finance Llc
Bought by
Federal National Mortgage Association
Purchase Details
Closed on
Feb 10, 2010
Sold by
Eldridge Knyszek Eileen E
Bought by
Chase Home Finance Llc
Purchase Details
Closed on
Oct 20, 1997
Sold by
Nedrow Dennis R
Bought by
Kelly Tonya F and Punches Sheila J
Home Financials for this Owner
Home Financials are based on the most recent Mortgage that was taken out on this home.
Original Mortgage
$48,450
Interest Rate
7.65%
Mortgage Type
FHA
Purchase Details
Closed on
Mar 15, 1994
Sold by
Vrabel Lourinda Etc
Bought by
Nedrow Dennis R
Purchase Details
Closed on
Dec 1, 1985
Create a Home Valuation Report for This Property
The Home Valuation Report is an in-depth analysis detailing your home's value as well as a comparison with similar homes in the area
Home Values in the Area
Average Home Value in this Area
Purchase History
| Date | Buyer | Sale Price | Title Company |
|---|---|---|---|
| Winegarden Blaine | $13,500 | Southern Title | |
| Federal National Mortgage Association | -- | None Available | |
| Chase Home Finance Llc | $16,000 | None Available | |
| Kelly Tonya F | $48,000 | -- | |
| Nedrow Dennis R | $38,900 | -- | |
| -- | $24,500 | -- |
Source: Public Records
Mortgage History
| Date | Status | Borrower | Loan Amount |
|---|---|---|---|
| Previous Owner | Kelly Tonya F | $48,450 |
Source: Public Records
Tax History
| Year | Tax Paid | Tax Assessment Tax Assessment Total Assessment is a certain percentage of the fair market value that is determined by local assessors to be the total taxable value of land and additions on the property. | Land | Improvement |
|---|---|---|---|---|
| 2024 | $461 | $9,630 | $2,220 | $7,410 |
| 2023 | $461 | $18,520 | $2,220 | $16,300 |
| 2022 | $430 | $7,530 | $2,140 | $5,390 |
| 2021 | $433 | $7,530 | $2,140 | $5,390 |
| 2020 | $443 | $7,530 | $2,140 | $5,390 |
| 2019 | $425 | $6,520 | $1,810 | $4,710 |
| 2018 | $420 | $6,520 | $1,810 | $4,710 |
| 2017 | $408 | $6,520 | $1,810 | $4,710 |
| 2016 | $309 | $4,790 | $2,570 | $2,220 |
| 2015 | $295 | $4,790 | $2,570 | $2,220 |
| 2014 | $292 | $4,790 | $2,570 | $2,220 |
| 2012 | $112 | $4,790 | $2,570 | $2,220 |
Source: Public Records
Map
Nearby Homes
- 394 S Main St
- 101 Chilton Ave
- 377 S Main St
- 133 Winwood Dr
- 27 Dunbilt Ct
- 571 Luther St
- 219 Lexington Ave
- 286 S Main St
- 273 Hammond Ave
- 0 Cline Ave Hedeen Abbeyfeale Unit 9066362
- 151 Grover St
- 519 S Diamond St
- 22 Small Ave
- 530 Wood St
- 466 Lexington Ave
- 470 Lexington Ave
- 29 Ford Ave
- 507 Townview Cir E
- 212 S Main St
- 223 Hedges St
Your Personal Tour Guide
Ask me questions while you tour the home.