32 Stone Gate Dr NW Cartersville, GA 30120
Estimated Value: $403,727 - $555,000
4
Beds
4
Baths
2,304
Sq Ft
$208/Sq Ft
Est. Value
About This Home
This home is located at 32 Stone Gate Dr NW, Cartersville, GA 30120 and is currently estimated at $478,932, approximately $207 per square foot. 32 Stone Gate Dr NW is a home located in Bartow County with nearby schools including Hamilton Crossing Elementary School, Cass Middle School, and Cass High School.
Ownership History
Date
Name
Owned For
Owner Type
Purchase Details
Closed on
Jul 23, 2010
Sold by
Federal National Mortgage Association
Bought by
Johnson Jason A
Current Estimated Value
Home Financials for this Owner
Home Financials are based on the most recent Mortgage that was taken out on this home.
Original Mortgage
$220,529
Outstanding Balance
$146,398
Interest Rate
4.7%
Mortgage Type
FHA
Estimated Equity
$332,534
Purchase Details
Closed on
May 4, 2010
Sold by
Bac Home Loans Servicing L
Bought by
Federal National Mtg Associati
Purchase Details
Closed on
Oct 21, 2005
Sold by
Stone Daniel K
Bought by
Lumsden Greig and Lumsden Christine
Home Financials for this Owner
Home Financials are based on the most recent Mortgage that was taken out on this home.
Original Mortgage
$54,000
Interest Rate
5.76%
Mortgage Type
New Conventional
Create a Home Valuation Report for This Property
The Home Valuation Report is an in-depth analysis detailing your home's value as well as a comparison with similar homes in the area
Home Values in the Area
Average Home Value in this Area
Purchase History
| Date | Buyer | Sale Price | Title Company |
|---|---|---|---|
| Johnson Jason A | $200,207 | -- | |
| Federal National Mtg Associati | -- | -- | |
| Bac Home Loans Servicing Lp | -- | -- | |
| Lumsden Greig | $270,000 | -- |
Source: Public Records
Mortgage History
| Date | Status | Borrower | Loan Amount |
|---|---|---|---|
| Open | Bac Home Loans Servicing Lp | $220,529 | |
| Previous Owner | Lumsden Greig | $54,000 | |
| Previous Owner | Lumsden Greig | $216,000 |
Source: Public Records
Tax History Compared to Growth
Tax History
| Year | Tax Paid | Tax Assessment Tax Assessment Total Assessment is a certain percentage of the fair market value that is determined by local assessors to be the total taxable value of land and additions on the property. | Land | Improvement |
|---|---|---|---|---|
| 2024 | $4,095 | $174,000 | $22,000 | $152,000 |
| 2023 | $4,072 | $155,970 | $22,660 | $133,310 |
| 2022 | $3,661 | $150,765 | $22,000 | $128,765 |
| 2021 | $3,400 | $134,044 | $23,600 | $110,444 |
| 2020 | $2,793 | $106,661 | $12,000 | $94,661 |
| 2019 | $2,784 | $105,299 | $12,000 | $93,299 |
| 2018 | $2,413 | $91,600 | $12,000 | $79,600 |
| 2017 | $2,425 | $91,600 | $12,000 | $79,600 |
| 2016 | $2,443 | $91,600 | $12,000 | $79,600 |
| 2015 | $2,447 | $91,600 | $12,000 | $79,600 |
| 2014 | $2,267 | $82,680 | $14,000 | $68,680 |
| 2013 | -- | $82,680 | $14,000 | $68,680 |
Source: Public Records
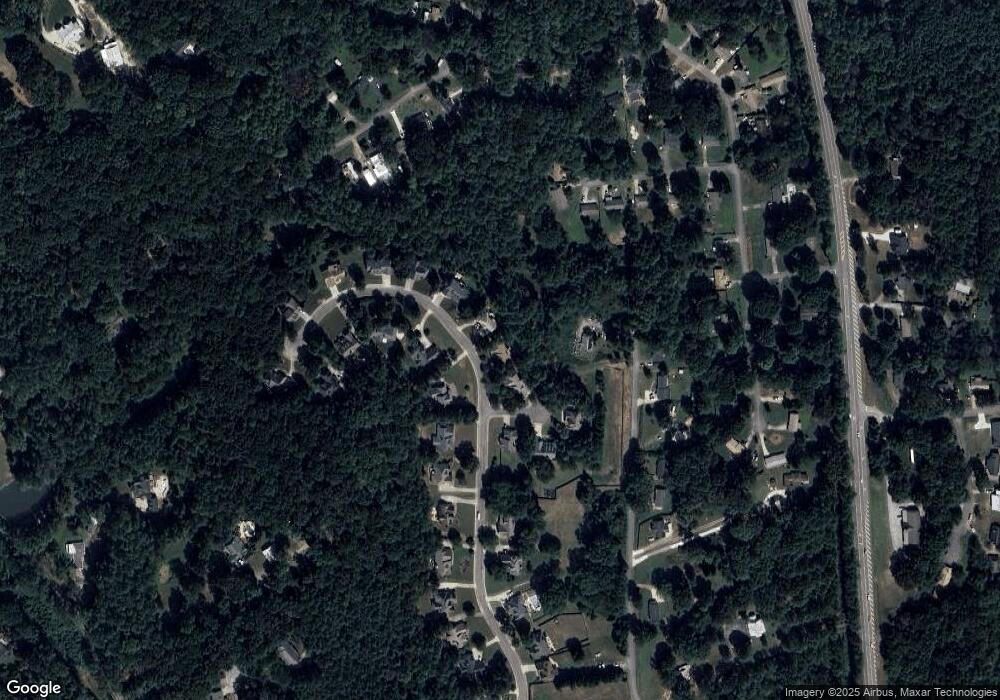
Map
Nearby Homes
- 145 McTier Cir NW
- 2396 Joe Frank Harris Pkwy NW
- 34 Fire Tower Rd NW
- 97 Gaddis Rd NW
- 65 Gaddis Rd NW
- 1820 Cassville Rd NW
- Dempsey Plan at Hamilton Place
- Liston Plan at Hamilton Place
- Braddock Plan at Hamilton Place
- Willard Plan at Hamilton Place
- Frazier Plan at Hamilton Place
- 129 NW Jane Blvd
- 131 Jane Blvd NW
- 136 Jane Blvd
- 109 Jane Blvd
- 124 Jane Blvd
- 132 Jane Blvd NW
- 120 NW Jane Blvd
- 122 Jane Blvd NW
- 34 Stone Gate Dr NW
- 30 Stone Gate Dr NW
- 0 Warren Cove
- 31 Stone Gate Dr NW
- 35 Stone Gate Dr NW
- 36 Stone Gate Dr NW
- 28 Stone Gate Dr NW
- 29 Stone Gate Dr NW
- 107 Akin Rd NW
- 12 Warren Cove NW
- 15 Warren Cove NW
- 39 Stone Gate Dr NW
- 38 Stone Gate Dr NW
- 43 Pine Ridge Ct
- 27 Stone Gate Dr NW
- 45 Stone Gate Dr NW
- 40 Stone Gate Dr NW
- 96 Akin Rd NW
- 47 Stone Gate Dr NW
- 47 Pine Ridge Ct NW