Estimated Value: $318,815 - $485,000
4
Beds
2
Baths
2,497
Sq Ft
$146/Sq Ft
Est. Value
About This Home
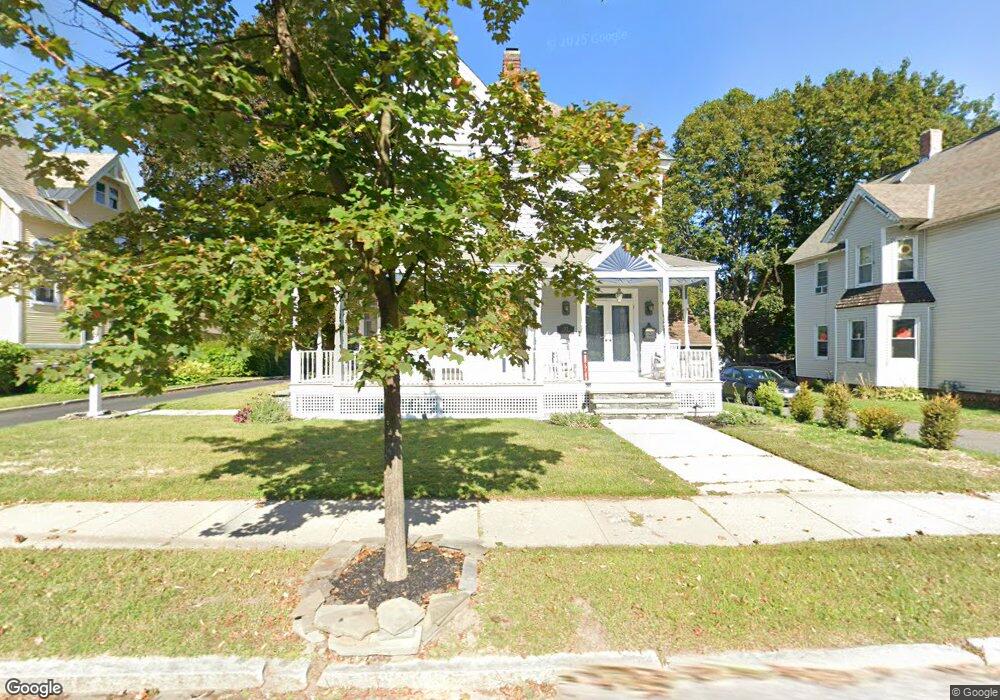
This home is located at 32 Summer St, Adams, MA 01220 and is currently estimated at $365,454, approximately $146 per square foot. 32 Summer St is a home located in Berkshire County with nearby schools including Hoosac Valley Middle & High School, Berkshire Arts & Technology Charter Public School, and St. Stanislaus Kostka School.
Ownership History
Date
Name
Owned For
Owner Type
Purchase Details
Closed on
Feb 15, 2020
Sold by
Trumble Lisa M and Baker Tracy A
Bought by
Trumble Baker Ft
Current Estimated Value
Purchase Details
Closed on
Oct 2, 1995
Sold by
Scott David R and Scott Cynthia A
Bought by
Trumble Lisa M
Home Financials for this Owner
Home Financials are based on the most recent Mortgage that was taken out on this home.
Original Mortgage
$126,074
Interest Rate
7.89%
Mortgage Type
Purchase Money Mortgage
Create a Home Valuation Report for This Property
The Home Valuation Report is an in-depth analysis detailing your home's value as well as a comparison with similar homes in the area
Home Values in the Area
Average Home Value in this Area
Purchase History
| Date | Buyer | Sale Price | Title Company |
|---|---|---|---|
| Trumble Baker Ft | -- | None Available | |
| Trumble Lisa M | $128,000 | -- |
Source: Public Records
Mortgage History
| Date | Status | Borrower | Loan Amount |
|---|---|---|---|
| Previous Owner | Trumble Lisa M | $102,000 | |
| Previous Owner | Trumble Lisa M | $10,000 | |
| Previous Owner | Trumble Lisa M | $10,000 | |
| Previous Owner | Trumble Lisa M | $126,074 |
Source: Public Records
Tax History
| Year | Tax Paid | Tax Assessment Tax Assessment Total Assessment is a certain percentage of the fair market value that is determined by local assessors to be the total taxable value of land and additions on the property. | Land | Improvement |
|---|---|---|---|---|
| 2025 | $4,855 | $285,400 | $41,100 | $244,300 |
| 2024 | $4,560 | $260,000 | $38,600 | $221,400 |
| 2023 | $4,229 | $228,000 | $35,500 | $192,500 |
| 2022 | $4,111 | $196,800 | $30,800 | $166,000 |
| 2021 | $3,970 | $175,500 | $30,800 | $144,700 |
| 2020 | $3,833 | $175,200 | $30,900 | $144,300 |
| 2019 | $3,748 | $175,200 | $30,900 | $144,300 |
| 2018 | $3,831 | $172,500 | $30,900 | $141,600 |
| 2017 | $3,686 | $172,500 | $30,900 | $141,600 |
| 2016 | $3,206 | $149,900 | $30,900 | $119,000 |
| 2015 | $3,114 | $145,700 | $32,500 | $113,200 |
| 2014 | $2,907 | $145,700 | $32,500 | $113,200 |
Source: Public Records
Map
Nearby Homes
Your Personal Tour Guide
Ask me questions while you tour the home.