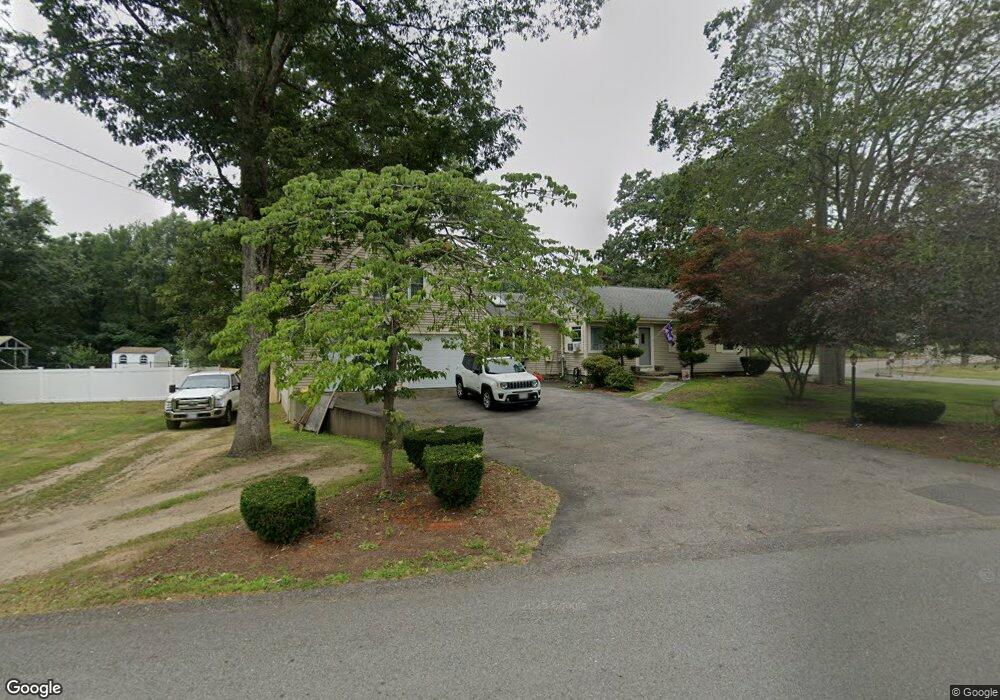
32 Summit Rd Abington, MA 02351
Estimated Value: $690,000 - $732,000
3
Beds
4
Baths
2,138
Sq Ft
$336/Sq Ft
Est. Value
About This Home
This home is located at 32 Summit Rd, Abington, MA 02351 and is currently estimated at $717,405, approximately $335 per square foot. 32 Summit Rd is a home located in Plymouth County with nearby schools including Woodsdale School, Beaver Brook Elementary School, and Abington Middle School.
Ownership History
Date
Name
Owned For
Owner Type
Purchase Details
Closed on
Sep 16, 2008
Sold by
Donovan Shawn P
Bought by
Walsh Christopher and Walsh Janice Salvator
Current Estimated Value
Purchase Details
Closed on
Aug 16, 2001
Sold by
Derose Daniel P and Alger Jacquelyn M
Bought by
Donovan Shawn P
Purchase Details
Closed on
Jun 25, 1999
Sold by
Centola Stephen D and Centola Kathleen M
Bought by
Alger Jacquelyn M and Derose Daniel P
Purchase Details
Closed on
Jun 30, 1994
Sold by
Taylor Mary A and Taylor Leland C
Bought by
Centola Stephen D and Mcdevitt Kathleen M
Create a Home Valuation Report for This Property
The Home Valuation Report is an in-depth analysis detailing your home's value as well as a comparison with similar homes in the area
Home Values in the Area
Average Home Value in this Area
Purchase History
| Date | Buyer | Sale Price | Title Company |
|---|---|---|---|
| Walsh Christopher | $410,000 | -- | |
| Donovan Shawn P | $299,900 | -- | |
| Alger Jacquelyn M | $229,400 | -- | |
| Centola Stephen D | $175,000 | -- |
Source: Public Records
Mortgage History
| Date | Status | Borrower | Loan Amount |
|---|---|---|---|
| Open | Centola Stephen D | $323,400 |
Source: Public Records
Tax History
| Year | Tax Paid | Tax Assessment Tax Assessment Total Assessment is a certain percentage of the fair market value that is determined by local assessors to be the total taxable value of land and additions on the property. | Land | Improvement |
|---|---|---|---|---|
| 2025 | $8,305 | $635,900 | $269,300 | $366,600 |
| 2024 | $7,859 | $587,400 | $245,400 | $342,000 |
| 2023 | $8,635 | $607,700 | $223,700 | $384,000 |
| 2022 | $8,363 | $549,500 | $187,400 | $362,100 |
| 2021 | $7,775 | $471,800 | $171,300 | $300,500 |
| 2020 | $7,888 | $464,000 | $172,500 | $291,500 |
| 2019 | $7,405 | $425,800 | $165,600 | $260,200 |
| 2018 | $5,196 | $419,000 | $165,600 | $253,400 |
| 2017 | $7,252 | $395,200 | $165,600 | $229,600 |
| 2016 | $6,528 | $364,100 | $151,400 | $212,700 |
| 2015 | $6,239 | $367,000 | $151,400 | $215,600 |
Source: Public Records
Map
Nearby Homes
- 337 Randolph St
- 120 Temple St
- 1077 Bedford St
- 1353 Washington St
- 66 Coleman St
- 0 Bedford St
- 22 Kingswood Dr Unit 6F
- 338 Adams St
- 451 Lincoln St
- 14 Jamieson St
- 590 Adams St
- 56 Townsend St Unit D26
- 720 Hancock St
- 120 Glen St
- 44 Old Forge Rd
- 189 Sheri Ln
- 332 Hancock St
- 73 Monroe St
- 1639 Main St
- 42 Van Buren Dr
Your Personal Tour Guide
Ask me questions while you tour the home.