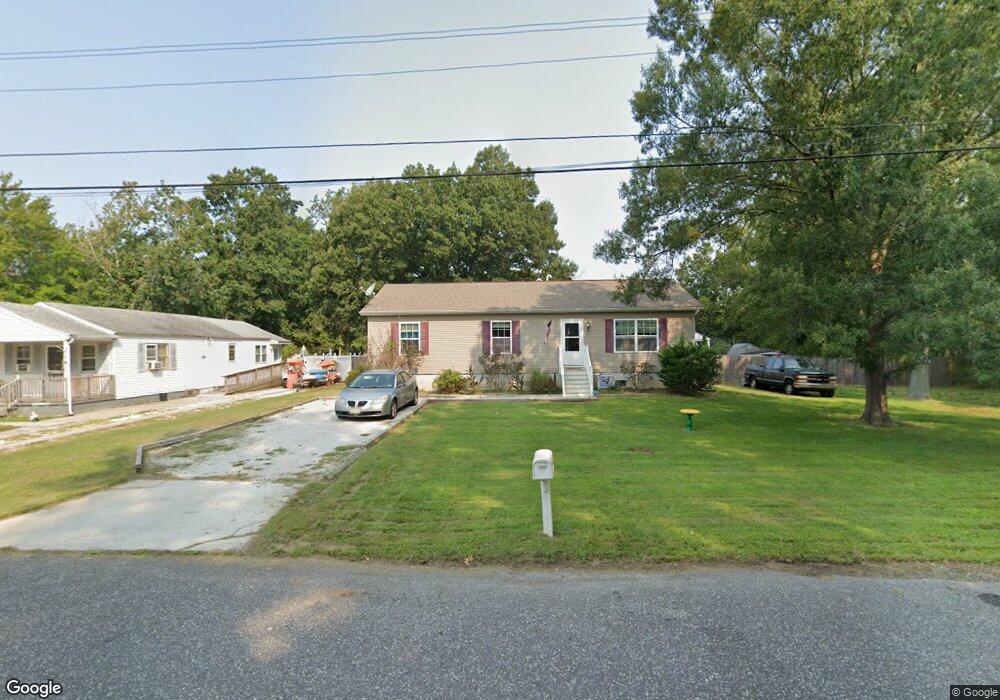
32 Susan Ln Cape May, NJ 08204
Estimated Value: $300,000 - $386,000
--
Bed
--
Bath
1,248
Sq Ft
$279/Sq Ft
Est. Value
About This Home
This home is located at 32 Susan Ln, Cape May, NJ 08204 and is currently estimated at $348,198, approximately $279 per square foot. 32 Susan Ln is a home with nearby schools including Middle Township Elementary No. 1, Middle Township Elementary No. 2, and Middle Township Middle School.
Ownership History
Date
Name
Owned For
Owner Type
Purchase Details
Closed on
Jun 3, 2011
Sold by
Herker William
Bought by
Moore Sarah J
Current Estimated Value
Home Financials for this Owner
Home Financials are based on the most recent Mortgage that was taken out on this home.
Original Mortgage
$185,492
Outstanding Balance
$128,949
Interest Rate
4.81%
Mortgage Type
New Conventional
Estimated Equity
$219,249
Purchase Details
Closed on
Oct 28, 2009
Sold by
Marino Richard and Marino Josette
Bought by
Herker William
Create a Home Valuation Report for This Property
The Home Valuation Report is an in-depth analysis detailing your home's value as well as a comparison with similar homes in the area
Home Values in the Area
Average Home Value in this Area
Purchase History
| Date | Buyer | Sale Price | Title Company |
|---|---|---|---|
| Moore Sarah J | $179,000 | Shore Title Agency Inc | |
| Herker William | $38,000 | None Available |
Source: Public Records
Mortgage History
| Date | Status | Borrower | Loan Amount |
|---|---|---|---|
| Open | Moore Sarah J | $185,492 |
Source: Public Records
Tax History Compared to Growth
Tax History
| Year | Tax Paid | Tax Assessment Tax Assessment Total Assessment is a certain percentage of the fair market value that is determined by local assessors to be the total taxable value of land and additions on the property. | Land | Improvement |
|---|---|---|---|---|
| 2025 | $4,388 | $197,400 | $100,000 | $97,400 |
| 2024 | $4,388 | $197,400 | $100,000 | $97,400 |
| 2023 | $4,272 | $197,400 | $100,000 | $97,400 |
| 2022 | $4,147 | $197,400 | $100,000 | $97,400 |
| 2021 | $4,043 | $197,400 | $100,000 | $97,400 |
| 2020 | $3,956 | $197,400 | $100,000 | $97,400 |
| 2019 | $3,867 | $197,400 | $100,000 | $97,400 |
| 2018 | $3,816 | $197,400 | $100,000 | $97,400 |
| 2017 | $3,731 | $197,400 | $100,000 | $97,400 |
| 2016 | $3,634 | $197,400 | $100,000 | $97,400 |
| 2015 | $3,597 | $197,400 | $100,000 | $97,400 |
| 2014 | $3,565 | $197,400 | $100,000 | $97,400 |
Source: Public Records
Map
Nearby Homes