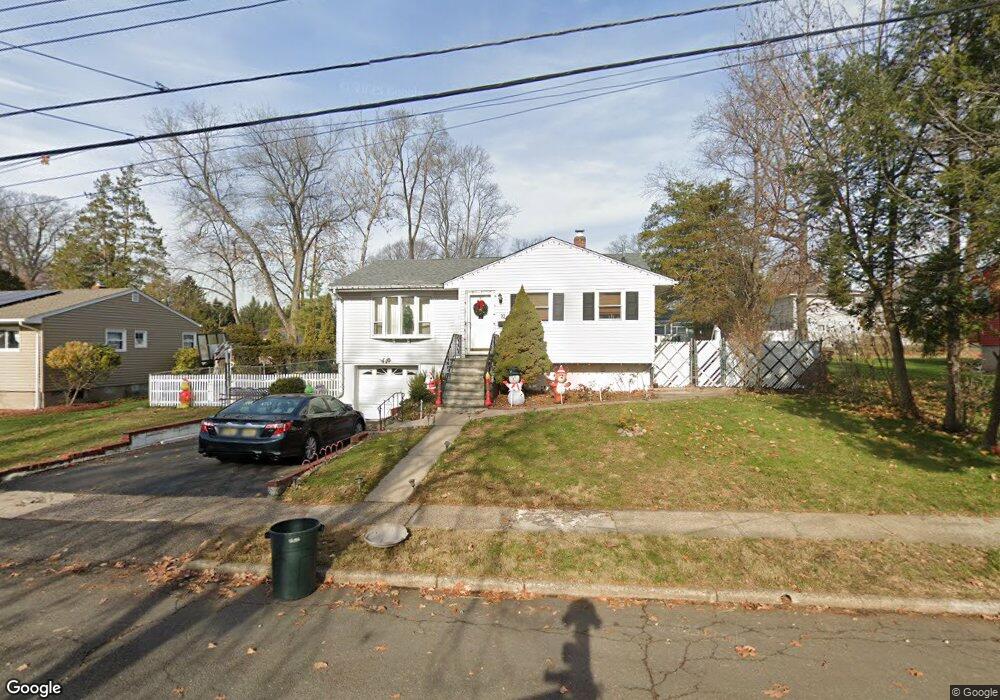
32 Sycamore Rd Dumont, NJ 07628
Estimated Value: $632,000 - $672,000
3
Beds
2
Baths
978
Sq Ft
$675/Sq Ft
Est. Value
About This Home
This home is located at 32 Sycamore Rd, Dumont, NJ 07628 and is currently estimated at $660,206, approximately $675 per square foot. 32 Sycamore Rd is a home located in Bergen County with nearby schools including Dumont High School and Solomon Schechter Day School.
Ownership History
Date
Name
Owned For
Owner Type
Purchase Details
Closed on
Oct 22, 2018
Sold by
Higgins David
Bought by
Pallatta Steven
Current Estimated Value
Purchase Details
Closed on
Jun 27, 2012
Sold by
Iwabuchi Masa and Iwabuchi Keiko
Bought by
Higgins David
Home Financials for this Owner
Home Financials are based on the most recent Mortgage that was taken out on this home.
Original Mortgage
$228,450
Interest Rate
3.76%
Mortgage Type
New Conventional
Create a Home Valuation Report for This Property
The Home Valuation Report is an in-depth analysis detailing your home's value as well as a comparison with similar homes in the area
Home Values in the Area
Average Home Value in this Area
Purchase History
| Date | Buyer | Sale Price | Title Company |
|---|---|---|---|
| Pallatta Steven | $354,250 | -- | |
| Higgins David | $285,565 | -- |
Source: Public Records
Mortgage History
| Date | Status | Borrower | Loan Amount |
|---|---|---|---|
| Previous Owner | Higgins David | $228,450 |
Source: Public Records
Tax History Compared to Growth
Tax History
| Year | Tax Paid | Tax Assessment Tax Assessment Total Assessment is a certain percentage of the fair market value that is determined by local assessors to be the total taxable value of land and additions on the property. | Land | Improvement |
|---|---|---|---|---|
| 2025 | $12,975 | $536,900 | $335,100 | $201,800 |
| 2024 | $12,656 | $319,200 | $190,200 | $129,000 |
| 2023 | $12,395 | $319,200 | $190,200 | $129,000 |
| 2022 | $12,395 | $319,200 | $190,200 | $129,000 |
| 2021 | $12,334 | $319,200 | $190,200 | $129,000 |
| 2020 | $11,999 | $319,200 | $190,200 | $129,000 |
| 2019 | $11,711 | $319,200 | $190,200 | $129,000 |
| 2018 | $11,472 | $319,200 | $190,200 | $129,000 |
| 2017 | $11,252 | $319,200 | $190,200 | $129,000 |
| 2016 | $10,990 | $319,200 | $190,200 | $129,000 |
| 2015 | $10,738 | $319,200 | $190,200 | $129,000 |
| 2014 | $10,527 | $319,200 | $190,200 | $129,000 |
Source: Public Records
Map
Nearby Homes