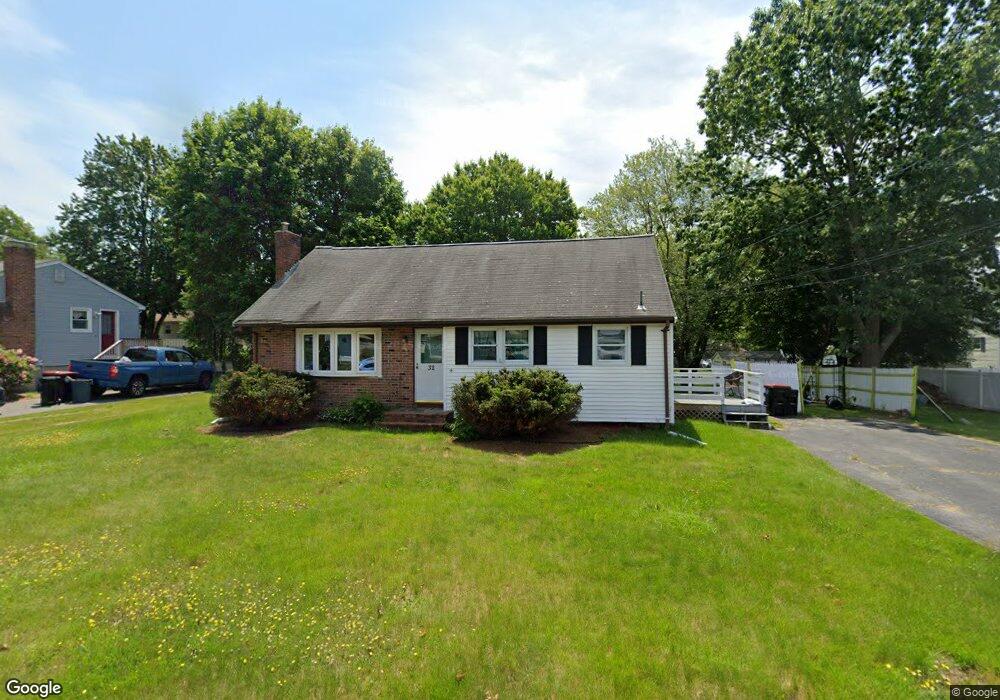
32 Taft Ave Unit Monson St Brockton, MA 02301
Estimated Value: $484,000 - $529,566
3
Beds
2
Baths
1,445
Sq Ft
$351/Sq Ft
Est. Value
About This Home
This home is located at 32 Taft Ave Unit Monson St, Brockton, MA 02301 and is currently estimated at $507,642, approximately $351 per square foot. 32 Taft Ave Unit Monson St is a home located in Plymouth County with nearby schools including Hancock Elementary School, Manthala George Jr. School, and Louis F Angelo Elementary School.
Ownership History
Date
Name
Owned For
Owner Type
Purchase Details
Closed on
Nov 30, 2018
Sold by
Davis Kyle E
Bought by
Pyrame Widline
Current Estimated Value
Home Financials for this Owner
Home Financials are based on the most recent Mortgage that was taken out on this home.
Original Mortgage
$294,566
Outstanding Balance
$259,882
Interest Rate
4.87%
Mortgage Type
FHA
Estimated Equity
$247,760
Purchase Details
Closed on
Oct 30, 2015
Sold by
Smith Stephen and Smith Dawn
Bought by
Davis Kyle E
Home Financials for this Owner
Home Financials are based on the most recent Mortgage that was taken out on this home.
Original Mortgage
$218,500
Interest Rate
3.92%
Mortgage Type
New Conventional
Purchase Details
Closed on
Jun 1, 1999
Sold by
Hurl Frances
Bought by
Smith Stephen and Smith Dawn
Purchase Details
Closed on
Jun 8, 1988
Sold by
Smith Paul F
Bought by
Hurl Frances
Create a Home Valuation Report for This Property
The Home Valuation Report is an in-depth analysis detailing your home's value as well as a comparison with similar homes in the area
Home Values in the Area
Average Home Value in this Area
Purchase History
| Date | Buyer | Sale Price | Title Company |
|---|---|---|---|
| Pyrame Widline | $300,000 | -- | |
| Davis Kyle E | $230,000 | -- | |
| Smith Stephen | $112,000 | -- | |
| Hurl Frances | $58,507 | -- |
Source: Public Records
Mortgage History
| Date | Status | Borrower | Loan Amount |
|---|---|---|---|
| Open | Pyrame Widline | $294,566 | |
| Previous Owner | Davis Kyle E | $218,500 | |
| Previous Owner | Hurl Frances | $40,000 | |
| Previous Owner | Hurl Frances | $175,000 | |
| Previous Owner | Hurl Frances | $10,000 |
Source: Public Records
Tax History Compared to Growth
Tax History
| Year | Tax Paid | Tax Assessment Tax Assessment Total Assessment is a certain percentage of the fair market value that is determined by local assessors to be the total taxable value of land and additions on the property. | Land | Improvement |
|---|---|---|---|---|
| 2025 | $5,435 | $448,800 | $143,900 | $304,900 |
| 2024 | $5,175 | $430,500 | $143,900 | $286,600 |
| 2023 | $5,005 | $385,600 | $108,600 | $277,000 |
| 2022 | $4,504 | $322,400 | $98,600 | $223,800 |
| 2021 | $4,510 | $311,000 | $90,900 | $220,100 |
| 2020 | $4,277 | $282,300 | $87,400 | $194,900 |
| 2019 | $3,944 | $253,800 | $80,700 | $173,100 |
| 2018 | $3,516 | $238,300 | $80,700 | $157,600 |
| 2017 | $3,516 | $218,400 | $80,700 | $137,700 |
| 2016 | $3,481 | $200,500 | $76,900 | $123,600 |
| 2015 | $3,528 | $194,400 | $76,900 | $117,500 |
| 2014 | $3,136 | $173,000 | $76,900 | $96,100 |
Source: Public Records
Map
Nearby Homes