Estimated Value: $833,955 - $1,123,000
2
Beds
3
Baths
2,918
Sq Ft
$318/Sq Ft
Est. Value
About This Home
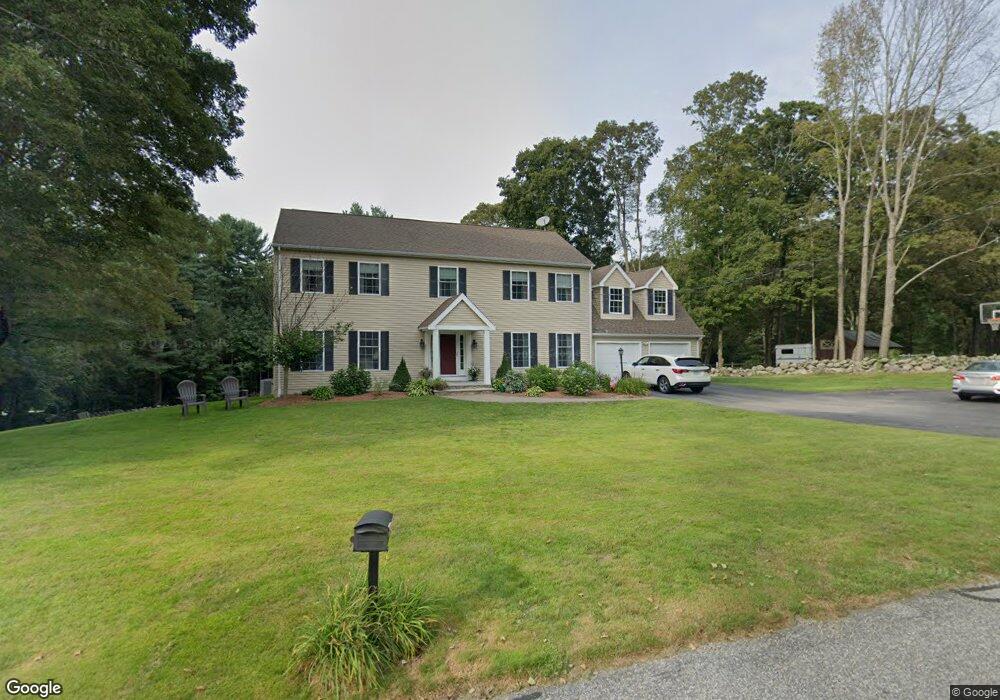
This home is located at 32 Taft St, Upton, MA 01568 and is currently estimated at $926,489, approximately $317 per square foot. 32 Taft St is a home located in Worcester County with nearby schools including Nipmuc Regional High School.
Ownership History
Date
Name
Owned For
Owner Type
Purchase Details
Closed on
Apr 3, 2006
Sold by
Flaherty Linda R and Flaherty Paul T
Bought by
Lacross Elizabeth and Lacross Richard
Current Estimated Value
Create a Home Valuation Report for This Property
The Home Valuation Report is an in-depth analysis detailing your home's value as well as a comparison with similar homes in the area
Home Values in the Area
Average Home Value in this Area
Purchase History
| Date | Buyer | Sale Price | Title Company |
|---|---|---|---|
| Lacross Elizabeth | $100,000 | -- | |
| Lacross Elizabeth | $100,000 | -- |
Source: Public Records
Tax History
| Year | Tax Paid | Tax Assessment Tax Assessment Total Assessment is a certain percentage of the fair market value that is determined by local assessors to be the total taxable value of land and additions on the property. | Land | Improvement |
|---|---|---|---|---|
| 2025 | $9,761 | $742,300 | $258,800 | $483,500 |
| 2024 | $9,503 | $694,700 | $234,800 | $459,900 |
| 2023 | $7,433 | $535,900 | $194,800 | $341,100 |
| 2022 | $8,933 | $532,700 | $194,800 | $337,900 |
| 2021 | $3,199 | $522,700 | $196,400 | $326,300 |
| 2020 | $8,515 | $494,500 | $174,000 | $320,500 |
| 2019 | $2,446 | $494,700 | $166,000 | $328,700 |
| 2018 | $4,534 | $477,300 | $158,800 | $318,500 |
| 2017 | $2,264 | $432,900 | $147,600 | $285,300 |
| 2016 | $8,647 | $465,900 | $158,800 | $307,100 |
| 2015 | $7,812 | $460,900 | $158,800 | $302,100 |
| 2014 | $7,573 | $446,800 | $150,800 | $296,000 |
Source: Public Records
Map
Nearby Homes
- 29 Cider Mill Ln
- 31 Elm St
- 78 Milford St
- 6 Wood St
- 130 High St
- 8 Maple St
- 7 Fieldstone Dr Unit 7
- 6 Fieldstone Dr Unit 6
- 11 East St
- 300 W Main St
- 50 Pinecrest Village Unit 50
- 13 Plain St
- 4 Hazeltine Rd
- 72 Main St
- 74 Warren St
- 10 Andrea Dr
- 63 Rockwood Ln Unit 63
- 18 Boot Shop Rd Unit 40
- 12 Boot Shop Rd Unit 37
- 5 Boot Shop Rd Unit 31
Your Personal Tour Guide
Ask me questions while you tour the home.