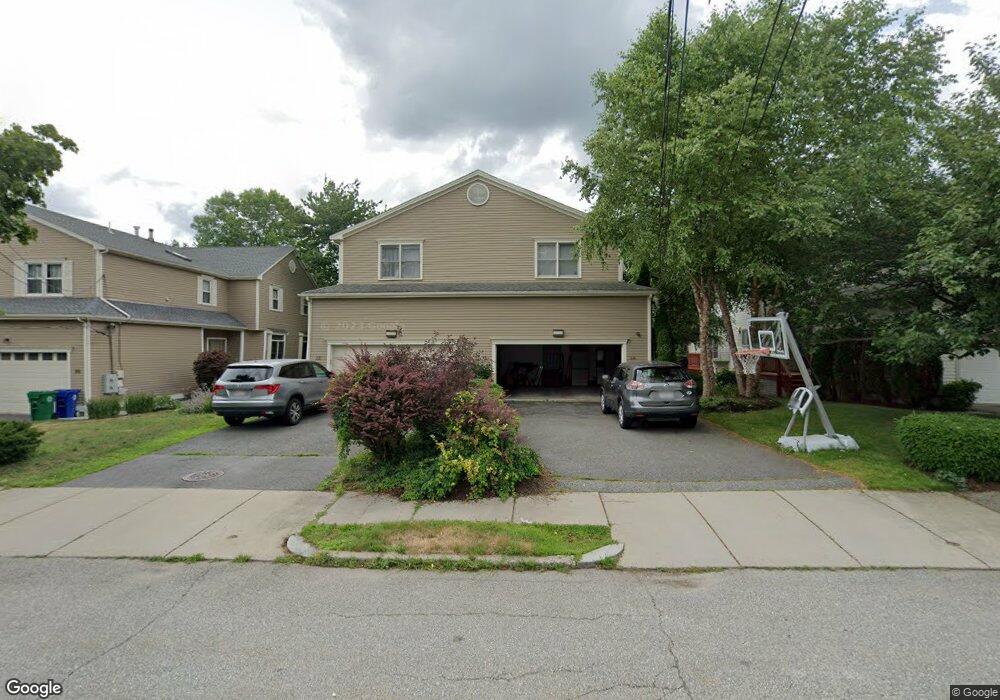
32 Tanglewood Rd Newton Center, MA 02459
Thompsonville NeighborhoodEstimated Value: $1,476,000 - $1,774,563
3
Beds
4
Baths
3,400
Sq Ft
$482/Sq Ft
Est. Value
About This Home
This home is located at 32 Tanglewood Rd, Newton Center, MA 02459 and is currently estimated at $1,639,641, approximately $482 per square foot. 32 Tanglewood Rd is a home located in Middlesex County with nearby schools including Bowen School, Memorial Spaulding Elementary School, and Oak Hill Middle School.
Ownership History
Date
Name
Owned For
Owner Type
Purchase Details
Closed on
Sep 7, 2012
Sold by
Gordon Mark and Trakhtenberg Sofia
Bought by
Trakhtenberg Sofia
Current Estimated Value
Purchase Details
Closed on
Apr 15, 2008
Sold by
Siff Eden and Zuker Lauren B
Bought by
Gordon Mark and Trakhtenberg Sofia
Purchase Details
Closed on
Mar 13, 2003
Sold by
Kane Kay S and Kane David D
Bought by
Siff Eden and Zuker Lauren B
Purchase Details
Closed on
May 28, 1997
Sold by
Tanglewood Dev T and Barges John
Bought by
Kane David D and Kane Kay S
Purchase Details
Closed on
Sep 4, 1996
Sold by
Bababekov Yekaterena
Bought by
Tanglewood Dev T and Barges John
Purchase Details
Closed on
Sep 28, 1990
Sold by
Chan Shek Tsang
Bought by
Bababeko Yekaterena
Create a Home Valuation Report for This Property
The Home Valuation Report is an in-depth analysis detailing your home's value as well as a comparison with similar homes in the area
Home Values in the Area
Average Home Value in this Area
Purchase History
| Date | Buyer | Sale Price | Title Company |
|---|---|---|---|
| Trakhtenberg Sofia | -- | -- | |
| Trakhtenberg Sofia | -- | -- | |
| Gordon Mark | $862,500 | -- | |
| Gordon Mark | $862,500 | -- | |
| Siff Eden | $750,000 | -- | |
| Siff Eden | $750,000 | -- | |
| Kane David D | $429,000 | -- | |
| Kane David D | $429,000 | -- | |
| Tanglewood Dev T | $220,000 | -- | |
| Tanglewood Dev T | $220,000 | -- | |
| Bababeko Yekaterena | $215,000 | -- | |
| Bababeko Yekaterena | $215,000 | -- |
Source: Public Records
Mortgage History
| Date | Status | Borrower | Loan Amount |
|---|---|---|---|
| Previous Owner | Bababeko Yekaterena | $523,750 | |
| Previous Owner | Bababeko Yekaterena | $523,750 |
Source: Public Records
Tax History Compared to Growth
Tax History
| Year | Tax Paid | Tax Assessment Tax Assessment Total Assessment is a certain percentage of the fair market value that is determined by local assessors to be the total taxable value of land and additions on the property. | Land | Improvement |
|---|---|---|---|---|
| 2025 | $15,235 | $1,554,600 | $0 | $1,554,600 |
| 2024 | $14,731 | $1,509,300 | $0 | $1,509,300 |
| 2023 | $14,479 | $1,422,300 | $0 | $1,422,300 |
| 2022 | $14,250 | $1,354,600 | $0 | $1,354,600 |
| 2021 | $13,750 | $1,277,900 | $0 | $1,277,900 |
| 2020 | $13,341 | $1,277,900 | $0 | $1,277,900 |
| 2019 | $12,965 | $1,240,700 | $0 | $1,240,700 |
| 2018 | $12,369 | $1,143,200 | $0 | $1,143,200 |
| 2017 | $11,993 | $1,078,500 | $0 | $1,078,500 |
| 2016 | $11,470 | $1,007,900 | $0 | $1,007,900 |
| 2015 | $11,144 | $959,900 | $0 | $959,900 |
Source: Public Records
Map
Nearby Homes
- 38 Tanglewood Rd
- 79 Florence St Unit 600S
- 79 Florence St Unit 402S
- 136 Dudley Rd
- 280 Boylston St Unit 203
- 280 Boylston St Unit 905
- 280 Boylston St Unit 710
- 280 Boylston St Unit 908
- 280 Boylston St Unit 415
- 280 Boylston St Unit 511
- 80 Louise Rd Unit 82
- 41-43 John Unit B
- 85 Dudley Rd
- 250 Hammond Pond Pkwy Unit 1604N
- 250 Hammond Pond Pkwy Unit 1002N
- 250 Hammond Pond Pkwy Unit 614S
- 250 Hammond Pond Pkwy Unit 603S
- 250 Hammond Pond Pkwy Unit 615N
- 250 Hammond Pond Pkwy Unit 306N
- 5 Heathwood Ln
- 34 Tanglewood Rd
- 34 Tanglewood Rd Unit 2 34
- 28 Tanglewood Rd
- 36 Tanglewood Rd
- 26 Tanglewood Rd
- 26 Tanglewood Rd
- 26 Tanglewood Rd Unit 10
- 22 Tanglewood Rd
- 22 Tanglewood Rd Unit 22
- 46 Tanglewood Rd
- 44 Tanglewood Rd
- 20 Tanglewood Rd
- 20 Tanglewood Rd Unit 1
- 20 Tanglewood Rd Unit 20
- 48 Tanglewood Rd Unit 48/50
- 27 Tanglewood Rd Unit 27
- 27 Tanglewood Rd
- 27 Tanglewood Rd Unit 2 27
- 27 Tanglewood Rd
- 27 Tanglewood Rd Unit 1