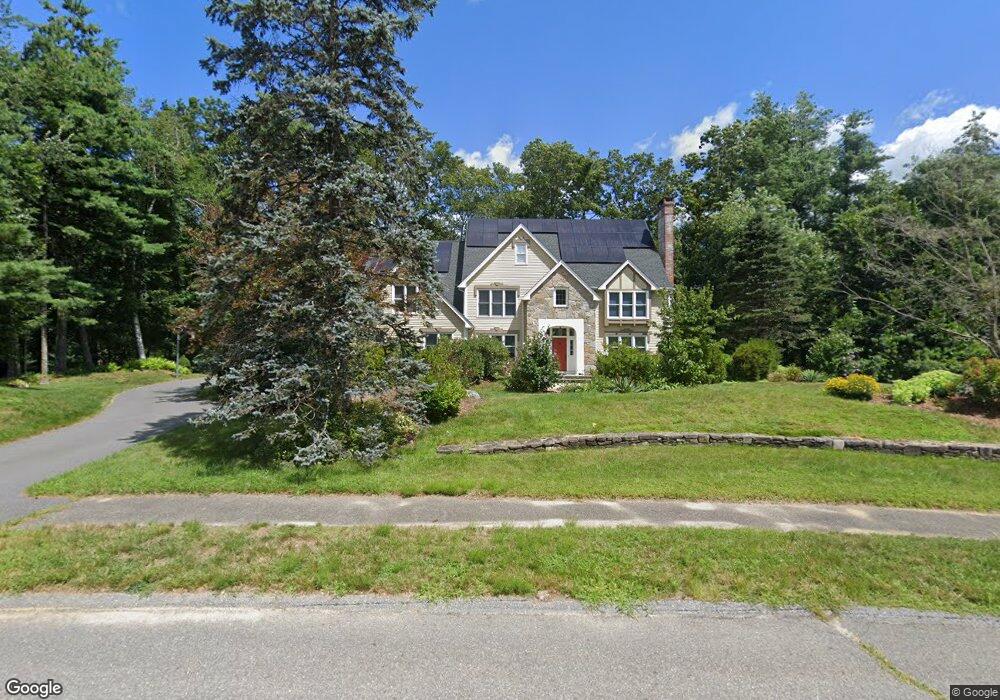
32 Tavern Cir Sudbury, MA 01776
Estimated Value: $1,516,000 - $1,796,000
4
Beds
3
Baths
3,790
Sq Ft
$433/Sq Ft
Est. Value
About This Home
This home is located at 32 Tavern Cir, Sudbury, MA 01776 and is currently estimated at $1,640,200, approximately $432 per square foot. 32 Tavern Cir is a home located in Middlesex County with nearby schools including Josiah Haynes Elementary School, Ephraim Curtis Middle School, and Lincoln-Sudbury Regional High School.
Ownership History
Date
Name
Owned For
Owner Type
Purchase Details
Closed on
Jun 30, 2005
Sold by
Easley David Mason and Easley Jonni Annette
Bought by
Wolf Gregory R and Reitzi Karen M
Current Estimated Value
Home Financials for this Owner
Home Financials are based on the most recent Mortgage that was taken out on this home.
Original Mortgage
$450,000
Outstanding Balance
$235,967
Interest Rate
5.73%
Mortgage Type
Purchase Money Mortgage
Estimated Equity
$1,404,233
Purchase Details
Closed on
Jan 30, 2001
Sold by
Stansky Michael P and Stansky Jill M
Bought by
Easley David M and Easley Jonnie A
Purchase Details
Closed on
Jul 19, 1994
Sold by
Obrien Edward J and Tischler Janet L
Bought by
Stansky Michael and Stansky Jill M
Purchase Details
Closed on
May 4, 1992
Sold by
Bldrs Collaborative
Bought by
Gilford Constr Co
Purchase Details
Closed on
Apr 16, 1991
Sold by
Broadview Rt
Bought by
Obrien Edward J and Tischler Janet L
Create a Home Valuation Report for This Property
The Home Valuation Report is an in-depth analysis detailing your home's value as well as a comparison with similar homes in the area
Home Values in the Area
Average Home Value in this Area
Purchase History
| Date | Buyer | Sale Price | Title Company |
|---|---|---|---|
| Wolf Gregory R | $975,000 | -- | |
| Easley David M | $800,000 | -- | |
| Stansky Michael | $520,000 | -- | |
| Gilford Constr Co | $95,000 | -- | |
| Obrien Edward J | $467,500 | -- |
Source: Public Records
Mortgage History
| Date | Status | Borrower | Loan Amount |
|---|---|---|---|
| Open | Obrien Edward J | $256,000 | |
| Closed | Obrien Edward J | $275,000 | |
| Open | Wolf Gregory R | $450,000 |
Source: Public Records
Tax History Compared to Growth
Tax History
| Year | Tax Paid | Tax Assessment Tax Assessment Total Assessment is a certain percentage of the fair market value that is determined by local assessors to be the total taxable value of land and additions on the property. | Land | Improvement |
|---|---|---|---|---|
| 2025 | $20,493 | $1,399,800 | $461,700 | $938,100 |
| 2024 | $19,705 | $1,348,700 | $448,100 | $900,600 |
| 2023 | $18,393 | $1,166,300 | $414,900 | $751,400 |
| 2022 | $17,604 | $975,300 | $380,500 | $594,800 |
| 2021 | $16,501 | $876,300 | $380,500 | $495,800 |
| 2020 | $16,168 | $876,300 | $380,500 | $495,800 |
| 2019 | $15,695 | $876,300 | $380,500 | $495,800 |
| 2018 | $15,260 | $851,100 | $400,500 | $450,600 |
| 2017 | $14,934 | $841,800 | $395,700 | $446,100 |
| 2016 | $14,473 | $813,100 | $380,500 | $432,600 |
| 2015 | $13,892 | $789,300 | $365,700 | $423,600 |
| 2014 | $13,874 | $769,500 | $354,900 | $414,600 |
Source: Public Records
Map
Nearby Homes
- 29 Black Birch Ln Unit 29
- 67 Powder Mill Rd
- 369 Border Rd
- 9 Black Birch Ln Unit 9
- 96 Forest Ridge Rd Unit 96
- 589 North Rd
- 5 Oak Ridge Dr Unit 7
- 29 Longfellow Rd
- 10 Oak Ridge Dr Unit 5
- 2 & 6 Powder Mill Rd
- 69 Powder Mill Rd
- 1 Maillet Dr
- 66 Powder Mill Rd
- 22 Garfield Ave
- 57 Longfellow Rd
- 5 Hayes St Unit 5
- 28 Waltham St Unit A
- 28 Waltham St Unit B
- 22-26 Waltham St
- 15 Arthur St Unit 15
- 26 Tavern Cir
- 38 Tavern Cir
- 20 Tavern Cir
- 35 Tavern Cir
- 25 Tavern Cir
- 42 Tavern Cir
- 11 Tavern Cir
- 10 Tavern Cir
- 60 Cranberry Cir
- 54 Cranberry Cir
- 66 Cranberry Cir
- 16 Tavern Cir
- 18 Tavern Cir
- 76 Cranberry Cir
- 46 Cranberry Cir
- 5 Tavern Cir
- 82 Cranberry Cir
- 38 Cranberry Cir
- 144 Powder Mill Rd
- 17 Rose Way