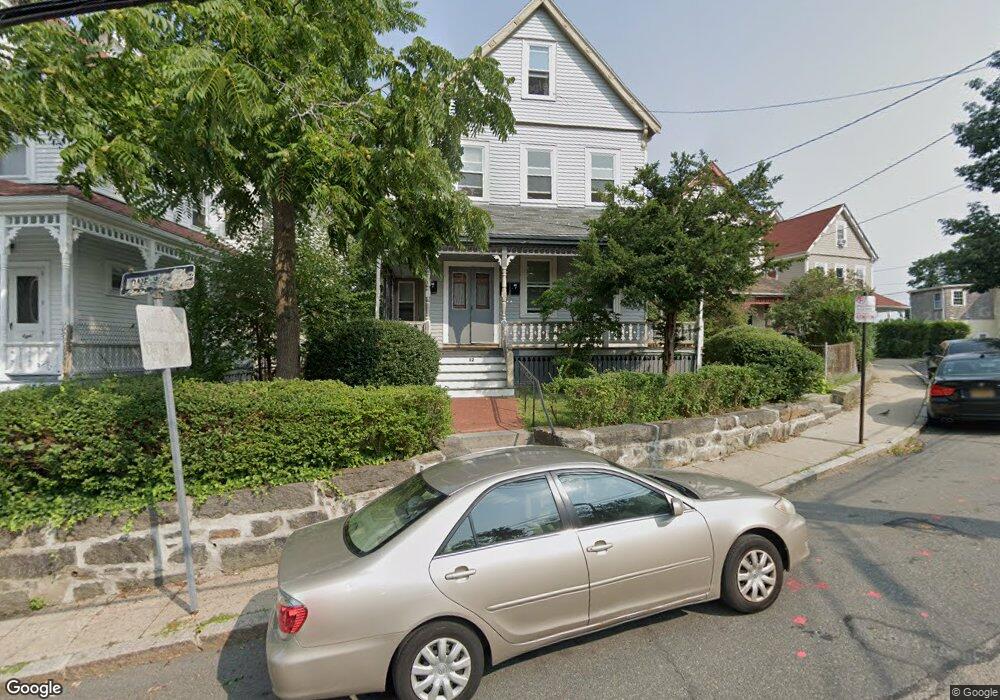
32 Thornton St Roxbury, MA 02119
Fort Hill NeighborhoodEstimated Value: $927,000 - $1,106,000
6
Beds
3
Baths
3,345
Sq Ft
$300/Sq Ft
Est. Value
About This Home
This home is located at 32 Thornton St, Roxbury, MA 02119 and is currently estimated at $1,004,333, approximately $300 per square foot. 32 Thornton St is a home located in Suffolk County with nearby schools including City on a Hill Charter Public School and Paige Academy.
Ownership History
Date
Name
Owned For
Owner Type
Purchase Details
Closed on
Mar 22, 2021
Sold by
Coley Fannye O Est
Bought by
Davis Stephanie M
Current Estimated Value
Purchase Details
Closed on
Aug 26, 2011
Sold by
Ocoley Fannye
Bought by
Ocoley Fannye and Davis Stephanie M
Create a Home Valuation Report for This Property
The Home Valuation Report is an in-depth analysis detailing your home's value as well as a comparison with similar homes in the area
Home Values in the Area
Average Home Value in this Area
Purchase History
| Date | Buyer | Sale Price | Title Company |
|---|---|---|---|
| Davis Stephanie M | -- | None Available | |
| Ocoley Fannye | -- | -- |
Source: Public Records
Tax History
| Year | Tax Paid | Tax Assessment Tax Assessment Total Assessment is a certain percentage of the fair market value that is determined by local assessors to be the total taxable value of land and additions on the property. | Land | Improvement |
|---|---|---|---|---|
| 2025 | $11,302 | $976,000 | $321,300 | $654,700 |
| 2024 | $9,775 | $896,800 | $236,700 | $660,100 |
| 2023 | $9,174 | $854,200 | $225,500 | $628,700 |
| 2022 | $9,022 | $829,200 | $218,900 | $610,300 |
| 2021 | $8,589 | $805,000 | $212,500 | $592,500 |
| 2020 | $7,894 | $747,500 | $220,800 | $526,700 |
| 2019 | $7,033 | $667,300 | $158,600 | $508,700 |
| 2018 | $6,475 | $617,800 | $158,600 | $459,200 |
| 2017 | $6,543 | $617,800 | $158,600 | $459,200 |
| 2016 | $4,964 | $451,248 | $133,224 | $318,024 |
| 2015 | $4,836 | $399,300 | $119,200 | $280,100 |
| 2014 | $4,375 | $347,800 | $119,200 | $228,600 |
Source: Public Records
Map
Nearby Homes
- 65 Lambert Ave
- 9 W Cedar St Unit 1
- 16 Hawthorne St
- 51 Saint James St
- 64 Alpine St Unit 104
- 64 Alpine St Unit 304
- 27 Dudley St
- 10 Linwood St
- 156-160 Highland St Unit 156
- 48-50 Dudley St
- 10 Roxbury St
- 187 Highland St
- 5 Valentine St Unit 1
- 22 Rockville Park
- 20 Rockville Park
- 21 Marcella St Unit 2
- 16 Mayfair St
- 150 Walnut Ave
- 2856 Washington St
- 8 Humboldt Ave Unit 2
- 32 Thornton St Unit 2
- 36 Thornton St
- 28 Thornton St
- 38 Thornton St
- 38 Thornton St Unit 1
- 38 Juniper St Unit 1
- 42 Juniper St
- 42 Juniper St Unit 1
- 48 Juniper St
- 34 Juniper St Unit 36
- 34 Juniper St Unit 36
- 34 Juniper St Unit 36
- 34 Juniper St Unit 1
- 34 Juniper St Unit 3
- 34 Juniper St Unit 2
- 41 Thornton St Unit 41
- 41 Thornton St
- 41 Thornton St Unit 2
- 35 Thornton St Unit 37
- 39 Thornton St Unit 41
Your Personal Tour Guide
Ask me questions while you tour the home.