
Landlord's Agent in 2025
Chip Roper
Roper Real Estate
(603) 236-2912
155 in this area
196 Total Sales


Estimated Value: $552,000 - $606,470
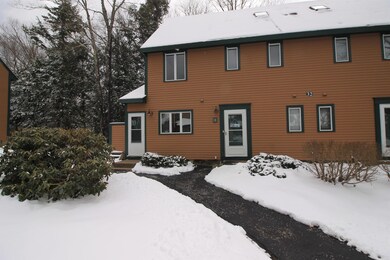
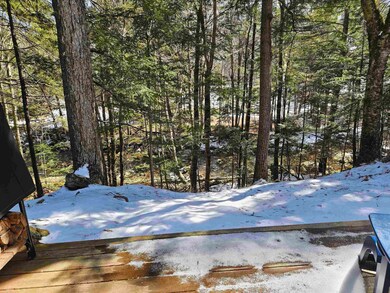
SUMMER THROUGH FALL RENTAL, Available anytime 5/1 through 11/1 with minimum period of renting of 3 months, rent negotiable for longer period between 5/1 to 11/1. Owner might allow a dog>>>>This Tyler Spring Townhouse is in a GREAT location right on Snows Brook! Relax to the sounds of the babbling brook just outside your back door in this duplex townhouse right in the heart of Waterville Valley. Enter the property on the living level with a good sized mudroom to the right along with a great half bath for convenience and visiting guests. The kitchen, dining area and living room are all connected which then leads out to a back patio overlooking Snows Brook, a nice place to relax and grill in the Summer! Nicely updated kitchen with granite countertops, tiled flooring are among several updates. Head upstairs to the sleeping spaces... the primary suite is large with a king sized bed and an attached full bath. Bedroom 2 offers a twin sized bed with a twin trundle that pulls out and a mounted TV on the wall. Just off the hallway is a full sized stackable washer and dryer along with a 2nd full bathroom. Head up another flight of stairs to find the 3rd bedroom which offers a queen bed and also has an attached bathroom. Cable, internet and any kerosene used for heating is included in the lease. Tenant pays for electric. This is a great spot to spend the Summer, come see why people love Tyler Spring! **SEE VIRTUAL SHOWING INCLUDED**
| Date | Buyer | Sale Price | Title Company |
|---|---|---|---|
| Steinberg Meghan | $410,000 | None Available | |
| Dilorenzo Anthony W | $210,000 | -- |
| Date | Status | Borrower | Loan Amount |
|---|---|---|---|
| Open | Steinberg Meghan | $328,000 |
| Date | Event | Price | List to Sale | Price per Sq Ft | Prior Sale |
|---|---|---|---|---|---|
| 04/28/2025 04/28/25 | Rented | $10,000 | +300.0% | -- | |
| 04/12/2025 04/12/25 | Off Market | $2,500 | -- | -- | |
| 04/07/2025 04/07/25 | Price Changed | $2,500 | -10.7% | $2 / Sq Ft | |
| 03/29/2025 03/29/25 | For Rent | $2,800 | 0.0% | -- | |
| 03/21/2022 03/21/22 | Sold | $410,000 | 0.0% | $262 / Sq Ft | View Prior Sale |
| 03/21/2022 03/21/22 | Pending | -- | -- | -- | |
| 03/21/2022 03/21/22 | For Sale | $410,000 | +95.2% | $262 / Sq Ft | |
| 08/15/2017 08/15/17 | Sold | $210,000 | 0.0% | $131 / Sq Ft | View Prior Sale |
| 08/15/2017 08/15/17 | Rented | $12,000 | 0.0% | -- | |
| 08/07/2017 08/07/17 | Under Contract | -- | -- | -- | |
| 08/02/2017 08/02/17 | For Rent | $12,000 | 0.0% | -- | |
| 07/20/2017 07/20/17 | Pending | -- | -- | -- | |
| 04/25/2016 04/25/16 | For Sale | $229,500 | -- | $143 / Sq Ft |
| Year | Tax Paid | Tax Assessment Tax Assessment Total Assessment is a certain percentage of the fair market value that is determined by local assessors to be the total taxable value of land and additions on the property. | Land | Improvement |
|---|---|---|---|---|
| 2024 | $4,911 | $543,300 | $0 | $543,300 |
| 2023 | $4,590 | $380,900 | $0 | $380,900 |
| 2022 | $4,038 | $380,900 | $0 | $380,900 |
| 2021 | $3,951 | $252,300 | $0 | $252,300 |
| 2020 | $3,595 | $252,300 | $0 | $252,300 |
| 2019 | $3,568 | $252,300 | $0 | $252,300 |
| 2018 | $3,568 | $252,300 | $0 | $252,300 |
| 2017 | $3,595 | $252,300 | $0 | $252,300 |
| 2016 | $2,983 | $213,100 | $0 | $213,100 |
| 2015 | $3,069 | $213,100 | $0 | $213,100 |
| 2014 | $2,856 | $213,100 | $0 | $213,100 |
| 2009 | $3,105 | $265,800 | $0 | $265,800 |
Landlord's Agent in 2025
Chip Roper
Roper Real Estate
(603) 236-2912
155 in this area
196 Total Sales
Seller's Agent in 2017
William Aronson
Waterville Valley Realty
(508) 341-3317
96 in this area
99 Total Sales
Source: PrimeMLS
MLS Number: 5034004
APN: WTVL-000106-001000-040013
Disclaimer: Certain information contained herein is derived from information provided by parties other than Homes.com. All information provided is deemed reliable, but is not guaranteed to be accurate and should be independently verified.
![]() Copyright 2025 PrimeMLS, Inc. All rights reserved. This information is deemed reliable, but not guaranteed. The data relating to real estate displayed on this display comes in part from the IDX Program of PrimeMLS. The information being provided is for consumers’ personal, non-commercial use and may not be used for any purpose other than to identify prospective properties consumers may be interested in purchasing.
Copyright 2025 PrimeMLS, Inc. All rights reserved. This information is deemed reliable, but not guaranteed. The data relating to real estate displayed on this display comes in part from the IDX Program of PrimeMLS. The information being provided is for consumers’ personal, non-commercial use and may not be used for any purpose other than to identify prospective properties consumers may be interested in purchasing.